


 28 May 2014
2014- n° 130In March 2014, the sales volume increased in household services and retail trade Sales volume in the retail trade and personal services - March 2014
28 May 2014
2014- n° 130In March 2014, the sales volume increased in household services and retail trade Sales volume in the retail trade and personal services - March 2014
In March 2014, the sales volume rose in household services (+0.8%), in the trade and repair of motor vehicles and motorcycles (+0.6%) and in the retail trade except for motor vehicles and motorcycles (+0.5%). On the opposite, it declined again in accommodation and food services (–1.5%).

Except indices from Emagsa survey, every index in this issue is in volume and seasonally and working-day adjusted (SA-WDA).
The commentary shows evolutions of subsections by decreasing contributions. The contribution of a subsection depends on the extent of the evolution and on its weight..
In March 2014, the sales volume rose in household services (+0.8%), in the trade and repair of motor vehicles and motorcycles (+0.6%) and in the retail trade except for motor vehicles and motorcycles (+0.5%). On the opposite, it declined again in accommodation and food services (–1.5%).
graphiqueGraph1_Anglais – Volume of sales in the retail trade and personal services
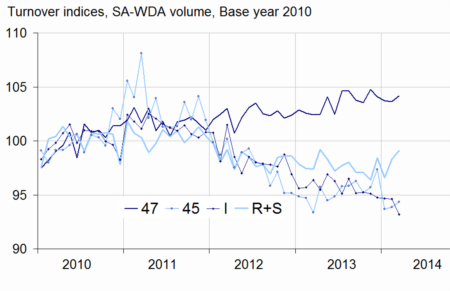
- Source: INSEE
Increase in the retail trade except for motor vehicles and motorcycles
In March, sales volume in retail trade except for motor vehicles and motorcycles grew (+0.5%) after a near-stability in February (–0.1%). In April, the sales volume is expected to edge up by +1.5 %.
The rise concerned specialised stores (+1.0%) and retail trade not in stores (stalls or markets or via mail order houses or Internet) (+0.6%). By contrast, sales volume slided in non specialised stores (–0.4%). In specialised stores, it rebounded in retail sale of automotive fuel (+3.9% after –3.5%) and increased significantly in retail sale of other goods (such as clothing, pharmaceuticals…) (+1.6%) while it fell back in retail sale of food, beverages and tobacco (–2.7%).
Over the last three months (q-o-q), the sales volume declined slightly in the retail trade, except for motor vehicles and motorcycles (–0.3%) but increased year on year (+1.2%).
tableauTab1_anglais – Variation of sales volume in the retail trade and personal services
| Change in % | |||||
|---|---|---|---|---|---|
| NACE Classification | Weight | March/ Feb. | Feb./ Jan. | q-o-q (1) | y-o-y (2) |
| 47 Retail trade, except for motor vehicles and motorcycles | 1000 | 0.5 | –0.1 | –0.3 | 1.2 |
| 471 Retail sale in non-specialised stores | 369 | –0.4 | 0.0 | –0.7 | –1.3 |
| 472 to 477 Retail sale in specialised stores | 573 | 1.0 | 0.0 | 0.0 | 2.8 |
| 478 and 479 Retail trade not in stores | 58 | 0.6 | –1.5 | –0.9 | 0.5 |
| 45 Trade and repair of motor vehicles and motorcycles | 1000 | 0.6 | 0.2 | –2.2 | –0.4 |
| I Accommodation and food service activities | 1000 | –1.5 | –0.1 | –0.9 | –1.8 |
| R+S Household services | 1000 | 0.8 | 1.8 | 0.7 | 0.4 |
| R Arts, entertainment and recreation | 449 | 1.3 | 2.4 | 0.3 | 0.0 |
| S Other service activities | 551 | 0.4 | 1.3 | 1.1 | 0.8 |
- (1) Quarter-on-quarter: last three months / three previous months.
- (2) Year-on-year: last three months / three same months of the previous year.
- The codes correspond to different levels of aggregation of the classification NAF rev.2
- Source: INSEE
tableauTabprecoce_anglais – Variation of sales volume in the retail trade : early estimate*
| Change in % | ||
|---|---|---|
| April 2014/ March 2014 | April 2014/ April 2013 | |
| 47 Retail trade, except for motor vehicles and motorcycles | 1.5 | 3.2 |
- * Econometric estimate from a set of sources available within 30 days after the end of the reference month
- Source: INSEE
Rise confirmed in trade and repair of motor vehicles and motorcycles
The growth of sales volume in trade and repair of motor vehicles and motorcycles was confirmed (+0.6% after +0.2% in February). It rebounded in the sale of motor vehicles (+0.7%) and increased again in the trade of motor vehicle parts and acessories (+0.6%).
The sales volume declined significantly over the last three months (–2.2%) and slightly year on year (–0.4%).
tableauTab2_anglais – Variation of sales volume in the retail trade and personal services
| Change in % | |||||
|---|---|---|---|---|---|
| Nace Classification | Weight | March 2014 | March/Feb. | Feb. /Jan. | q-o-q (1) |
| 47 Retail trade, except for motor vehicles and motorcycles | 1000 | 104.2 | 0.5 | –0.1 | –0.3 |
| 471 Non-specialised stores | 369 | 98.7 | –0.4 | 0.0 | –0.7 |
| 472 à 477 Specialised stores | 573 | 107.8 | 1.0 | 0.0 | 0.0 |
| 472 Retail sale of food. beverages and tobacco in specialised stores | 49 | 99.5 | –2.7 | 0.2 | 0.0 |
| 473 Retail sale of automotive fuel | 78 | 96.9 | 3.9 | –3.5 | –1.9 |
| 474 Retail sale of information and communication equipment | 28 | 138.7 | –0.9 | –0.2 | 0.2 |
| 475 Retail sale of other household equipment | 112 | 100.5 | 0.3 | 0.0 | 0.1 |
| 476 Retail sale of cultural and recreation goods | 48 | 100.2 | –0.1 | 2.9 | –0.9 |
| 477 Retail sale of other goods in specialised stores | 258 | 113.9 | 1.6 | 0.5 | 0.7 |
| 478 et 479 Retail trade not in stores | 58 | 103.3 | 0.6 | –1.5 | –0.9 |
| 45 Wholesale and retail trade and repair of motor vehicles and motorcycles | 1000 | 94.4 | 0.6 | 0.2 | –2.2 |
| 451 Sale of motor vehicles | 671 | 92.4 | 0.7 | –0.5 | –2.7 |
| 452 Maintenance and repair of motor vehicles | 78 | 90.2 | –1.1 | 1.9 | –2.7 |
| 453 Sale of motor vehicle parts and accessories | 227 | 102.1 | 0.6 | 1.4 | –1.1 |
| 454 Sale. maintenance and repair of motorcycles and related parts and accessories | 24 | 91.0 | 1.3 | 1.3 | 0.2 |
| I Accommodation and food service activities | 1000 | 93.2 | –1.5 | –0.1 | –0.9 |
| 55 Accommodation | 255 | 92.6 | –4.2 | –0.4 | –1.5 |
| 56 Food and beverage service activities | 745 | 93.4 | –0.6 | 0.1 | –0.7 |
| 561 Restaurants… | 549 | 93.0 | –0.2 | –0.6 | –0.6 |
| 562 Event catering… | 116 | 99.2 | –2.0 | 3.4 | –1.5 |
| 563 Beverage serving activities | 80 | 87.7 | –1.1 | –0.7 | –0.4 |
| R+S Household services | 1000 | 99.1 | 0.8 | 1.8 | 0.7 |
| R Arts, entertainment and recreation | 449 | 98.6 | 1.3 | 2.4 | 0.3 |
| 90 Creative. arts and entertainment activities | 115 | 100.1 | 1.7 | 0.0 | 3.4 |
| 91 Libraries. archives. museums… | 11 | 108.9 | 0.8 | 3.5 | 2.0 |
| 92 Gambling and betting activities | 119 | 106.1 | 2.5 | 7.9 | –0.5 |
| 93 Sports activities and amusement... | 204 | 92.9 | 0.2 | 0.4 | –1.0 |
| S Other service activities | 551 | 99.5 | 0.4 | 1.3 | 1.1 |
| 95 Repair of computers… | 228 | 102.9 | 1.7 | 3.2 | 3.0 |
| 96 Other personal service activities | 323 | 97.0 | –0.6 | 0.0 | –0.3 |
- (1) Quarter-on-quarter: last three months / three previous months.
- Source: Insee
Fall in accommodation and food service activities
Sales volume in accommodation and food service activities fell (–1.5%) after a near-stabilty in February (–0.1%). It plunged in accommodation (–4.2%) and in event catering and other food services (–2.0%). It decreased slightly in restaurants and fast food services (–0.2%).
The sales volume of the whole sector was down the last three months (–0.9%) and year on year (–1.8%).
Another rise in household services
Sales volume in household services went on increasing in March (+0.8% after +1.8% in February). It grew significantly in repair of computers and personal and household goods (+1.7%) and in gambling and betting activities (+2.5%).
The sales volume in household services increased over the last three months (+0.7%) and year on year (+0.4%).
Revisions
Changes for February were revised by +0.2 point in household services.and by –0.1 point in retail trade except for motor vehicles and motorcycles and in accommodation and food services activities. The sector of trade and repair of motor vehicles and motorcycles remained unchanged.
Monthly survey about large-scale food retailing
Turnover in large-scale food retailing dipped slightly in April (–0.1%). Sales declined whatever the type of products but the fall was significant for automotive fuel (–1.0%).
tableauTab3_anglais – Monthly turnover indices in large scale food retailing
| Change in % | ||||
|---|---|---|---|---|
| April/ March | March/ Feb. | q-o-q (1) | y-o-y (1) | |
| Turnover | –0.1 | 0.1 | –1.4 | –0.3 |
| Including | ||||
| Sales of food products | –0.3 | –0.2 | –1.0 | –0.9 |
| Sales of non-food products | –0.3 | –0.1 | 0.2 | –2.0 |
| Sales of automotive fuel | –1.0 | 0.6 | –6.0 | –6.7 |
- (1) Quarter-on-quarter: last three months / three previous months.
- Source: INSEE - Monthly survey about large-scale food retailing (Emagsa)
Documentation
Methodology (pdf,121 Ko)
Pour en savoir plus
