


 30 June 2014
2014- n° 153Overall producer prices of agricultural products decreased in May Indices of agricultural prices - May 2014
30 June 2014
2014- n° 153Overall producer prices of agricultural products decreased in May Indices of agricultural prices - May 2014
In May, overall agricultural producer prices dropped by 1.8 % compared to April ; over one year they fell by 5.2 %.
In May, overall agricultural producer prices dropped by 1.8 % compared to April ; over one year they fell by 5.2 %.
Cereal prices tumbled in May (–6.3 %). The available quantities were huge and the good weather conditions allowed to foresee abundant crops. Moreover, the political turmoil in Ukraine did not affect its exportations of cereals.
graphiquecereal – Producer prices of cereals

Oleaginous prices decreased in May (-5.3 %) due to an abundant supply in Europe.
Overall prices of wines increased by 14.3 % over one year (and by 23.1 % for PDO wines), further to the drop in crops for the last two years.
Potato prices tumbled compared to last year (-41.4 %). This was a return to normal as the last but one crop, in 2012, had been particularly weak in North-Western Europe.
Fresh fruits prices decreased year-over-year (–17.2 %). The production of apples had indeed increased in 2013, which was the last crop available. The good weather conditions sped up the earliness of strawberries ; moreover, the yields were better due to the increasing share of greenhouse growings.
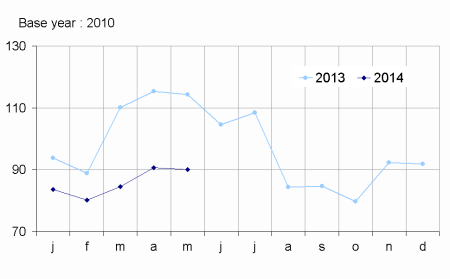
graphiquevegetable – Producer prices of fresh vegetables
- Source : SSP (ministry of agriculture)
Fresh vegetable prices plumeted year-over-year (–21.2%). The balmy weather and the luminosity of the early spring amplified the precocity of greenhouse growings for tomatoes, lettuce and cucumbers.
graphiquepig – Producer prices of large cattle and pigs
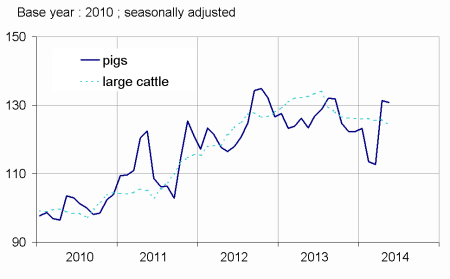
On a seasonally adjusted basis, animal prices decreased in May (-0.8 %). Prices for pigs were almost stable. Indeed the sanitary crisis in the United States limited the production and the exportations of this country and therefore offset the Russian embargo on European pigs. Cattle prices slipped by almost 6 % over one year, reflecting the erosion in beef consumption. Milk price have been slumping for a quarter, after the global production balanced the marked increase in the demand from Asia and other emerging countries. Over one year milk prices rebounded by 7.1 %.
tableauTab1 – Indices of producer prices of agricultural products (IPPAP)
| Variation as % over | |||||
|---|---|---|---|---|---|
| weights | May 2014 | a month | 3 months | a year | |
| raw | Seasonally adjusted | raw | |||
| Agricultural goods output | 1000 | 116.0 | –1.8 | +0.1 | –5.2 |
| excluding fruits and vegetables | 900 | 118.4 | –1.6 | +0.1 | –3.9 |
| Crop output (excluding fruits and vegetables) | 503 | 120.0 | –2.5 | +0.5 | –7.5 |
| Cereals | 188 | 114.1 | –6.3 | –0.5 | –16.9 |
| of which soft wheat | 112 | 115.0 | –6.4 | –0.9 | –17.4 |
| grain maize | 41 | 102.4 | –7.0 | –1.6 | –22.3 |
| Potatoes | 26 | 126.7 | /// | /// | –41.4 |
| Wines | 177 | 133.7 | +1.2 | +3.5 | +14.3 |
| Protected designation of origin | 84 | 147.1 | +2.0 | +6.4 | +23.1 |
| other wines | 23 | 131.8 | +0.4 | +0.1 | +7.3 |
| Oleaginous | 49 | 99.4 | –5.3 | –2.1 | –19.3 |
| Horticultural products | 30 | 107.7 | +1.4 | +1.6 | +0.5 |
| Other crop products | 33 | 117.0 | +0.4 | –0.7 | –0.4 |
| Fruits and vegetables (1) | 100 | 94.0 | /// | /// | –17.3 |
| Fresh vegetables | 53 | 90.1 | /// | /// | –21.2 |
| Fresh fruits | 35 | 93.5 | /// | /// | –17.2 |
| Animal output | 397 | 116.4 | –0.4 | –0.4 | +1.2 |
| Animals | 235 | 121.3 | –0.8 | +2.6 | –2.2 |
| of which large cattle | 96 | 124.7 | –1.2 | –1.4 | –5.8 |
| calves | 26 | 111.7 | –1.9 | –3.6 | +1.5 |
| pigs | 54 | 125.7 | –0.4 | +15.3 | +6.1 |
| sheep | 10 | 123.6 | +1.1 | +9.7 | +7.1 |
| poultry | 46 | 115.2 | 0.0 | –0.4 | –7.3 |
| of which chicken | 28 | 115.2 | 0.0 | –0.3 | –7.4 |
| Milk | 147 | 109.6 | 0.0 | –4.5 | +7.1 |
| of which cow milk (2) | 137 | 110.3 | 0.0 | –4.7 | +7.4 |
| Eggs | 15 | 105.3 | +0.8 | –6.1 | +9.3 |
- 1) Including vegetables for industry.
- (2) The price for May is not yet known and therefore is estimated by carrying forward the seasonally adjusted price from April
- Sources: Insee - SSP (ministry of agriculture)
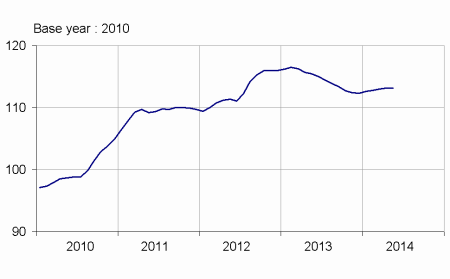
Purchase prices of the means of agricultural production were stable in May.
Overall prices of intermediate consumptions stagnated in May. Over one year, animal feed and fertilisers prices decreased by roughly 7%. Investment prices remained stable in May (-0.1 %).
graphiquemeans – Purchase price of the means of agricultural production
tableauTab2 – Indices of purchase prices of the means of agricultural production (IPAMPA)
| weights | May 2014 | Variation as % over | |||
|---|---|---|---|---|---|
| a month | 3 months | a year | |||
| Total input | 1000 | 113.1 | 0.0 | +0.3 | –2.1 |
| Intermediate consumptions | 764 | 115.2 | 0.0 | +0.3 | –2.9 |
| Energy (1) | 100 | 116.1 | –0.2 | –2.2 | –0.9 |
| Seeds | 57 | 109.3 | +0.1 | +0.5 | +0.8 |
| Fertilisers and soil improvers | 92 | 119.9 | +0.3 | +2.9 | –6.8 |
| Plant protection products | 78 | 101.5 | +0.2 | +1.4 | +0.5 |
| Animal feed | 205 | 126.1 | –0.1 | +0.2 | –7.2 |
| Veterinary expenses | 43 | 111.1 | +0.1 | +0.4 | +2.2 |
| Small equipment and tools | 17 | 107.5 | –0.2 | –1.1 | –0.7 |
| Maintenance of materials | 67 | 111.2 | –0.1 | 0.0 | +2.6 |
| Maintenance of buildings | 9 | 106.7 | –0.1 | +0.1 | –0.3 |
| Other goods and services | 97 | 101.8 | 0.0 | 0.0 | 0.0 |
| Goods and services contributing to investment | 236 | 106.8 | –0.1 | +0.2 | +1.0 |
| Material | 186 | 106.7 | –0.2 | +0.2 | +1.6 |
| Tractors | 79 | 107.3 | –0.3 | +0.6 | +1.7 |
| Machinery and plant for cultivation | 36 | 107.3 | –0.5 | –0.5 | +2.7 |
| Machinery and plant for harvesting | 42 | 107.0 | 0.0 | 0.0 | +1.1 |
| Utility vehicles | 18 | 103.2 | 0.0 | –0.1 | +0.7 |
| Total input | 50 | 107.1 | +0.2 | +0.6 | –0.9 |
- (1) The repayment of the domestic tax on energy products (TICPE) benefiting farmers has been applied in advance for the year 2014
- Sources: Insee - SSP (ministry of agriculture)
Documentation
Methodology (pdf,122 Ko)
Pour en savoir plus
Time series : Indices of agricultural prices
