


 29 November 2013
2013- n° 275Overall producer prices of agricultural products were stable in October Indices of agricultural prices - October 2013
29 November 2013
2013- n° 275Overall producer prices of agricultural products were stable in October Indices of agricultural prices - October 2013
In October 2013, overall producer prices of agricultural products were stable compared to September; they decreased by 6.3 % over one year.
In October 2013, overall producer prices of agricultural products were stable compared to September; they decreased by 6.3 % over one year.
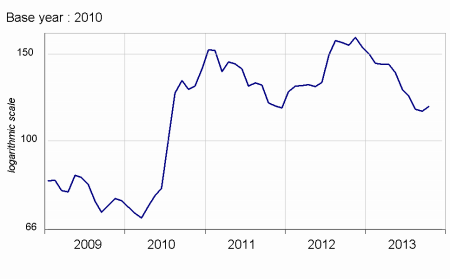
Cereal prices rallied in October (+2.4 %). Wheat prices noticeably increased due to a sustained demand and anticipations of supply cuts in 2014 : the stocks could indeed be decreasing next year as a result of weak crops forecast in Argentina and Ukraine. Maïze prices continued to drop driven by the announcement of the significant crop in the United-States.
graphiquecereal – Producer prices of cereals
Oleaginous prices increased again this month (+1.1 %). The demand for rape might have risen due to an expected surge in the manufacturing of biodiesel in Europe further to the augmentation of custom duties on this fuel, as the imported biodiesels (Argentine and Indonesian) are not made with this grain.
Potato prices stayed at a high level declining only slightly compared to last year (–2.3 %). The crop in North-Western Europe rose only slightly as a result of the tumble in yields in Germany.
Wine prices rose in October compared to September (+3.2 %) reflecting the increase in prices for PDO wines.
Fresh fruits prices dropped year-over-year (–7.6 %). Apple and pear prices decreased as their production rose sharply this year. Moreover, consumers stayed aside from pear due to the balmy weather in October.
graphiquevegetable – Producer price of fresh vegetables
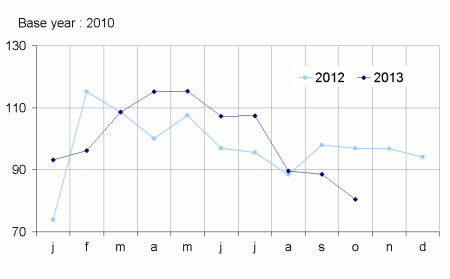
Fresh vegetables prices decreased year-over-year (–16.9 %). On the demand side, leeks and chicories sold less easily because of mild temperatures. On the supply side, the mild weather accelerated the maturity of cauliflowers, lettuces and lamb’s lettuces which were then quickly delivered.
graphiquepig – Producer prices of pigs and large cattle
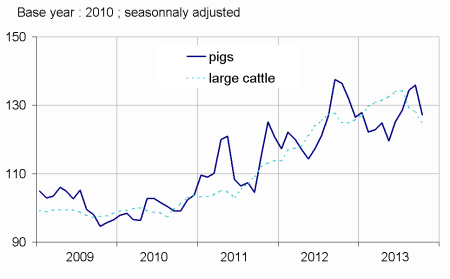
On a seasonally adjusted basis, animals prices dipped in October (-2.9 %). Prices of big cattle stagnated over one year due to a limited supply, which balanced a sluggish demand. Pigs were noticeably less expensive, as a result of German competition. The celebration of Aïd led to a seasonal extra supply of lambs but the demand stayed behind : sheep prices went down compared to September.
Egg prices picked up (+2.9 %) for the second month in a row, after an over-production period.
tableauTab1 – Indices of producer prices of agricultural products (IPPAP)
| Variation as % over | |||||
|---|---|---|---|---|---|
| weights | Oct. 2013 | a month | 3 month | a year | |
| raw | Seasonally adjusted data | raw | |||
| Agricultural goods output | 1000 | 117.0 | 0.0 | –3.9 | –6.3 |
| excluding fruits and vegetables | 900 | 119.0 | +0.1 | –3.1 | –5.8 |
| Crop output (excluding fruits and vegetables) | 502 | 119.3 | +1.6 | –3.6 | –10.5 |
| Cereals | 190 | 117.5 | +2.4 | –4.6 | –25.0 |
| of which soft wheat | 113 | 119.0 | +5.8 | +2.2 | –24.3 |
| grain maize | 42 | 105.9 | –4.0 | –20.4 | –29.0 |
| Potatoes | 26 | 169.5 | /// | /// | –2.3 |
| Wines | 171 | 123.5 | +3.2 | +3.4 | +12.3 |
| Protected designation of origin | 135 | 123.5 | +3.8 | +4.4 | +14.6 |
| other wines | 36 | 123.2 | +0.9 | –0.4 | +4.4 |
| Oleaginous | 49 | 99.2 | +1.1 | –7.1 | –24.2 |
| Horticultural products | 31 | 106.4 | +0.7 | +0.1 | +1.7 |
| Other crop products | 34 | 111.9 | 0.0 | –4.8 | –7.0 |
| Fruits and vegetables (1) | 100 | 97.9 | /// | /// | –11.8 |
| Fresh vegetables | 51 | 80.5 | /// | /// | –16.9 |
| Fresh fruits | 41 | 122.2 | /// | /// | –7.6 |
| Animal output | 398 | 118.5 | –1.7 | –2.4 | +0.9 |
| Animals | 234 | 122.3 | –2.9 | –3.9 | –2.0 |
| of which large cattle | 96 | 125.7 | –2.2 | –6.8 | 0.0 |
| calves | 26 | 106.4 | +0.2 | 0.0 | –0.9 |
| pigs | 54 | 127.9 | –6.4 | –1.0 | –6.7 |
| sheep | 10 | 119.6 | –3.7 | –5.3 | +7.3 |
| poultry | 44 | 118.1 | –1.1 | –2.7 | –2.4 |
| of which chicken | 18 | 119.2 | –1.4 | –3.0 | –2.8 |
| Milk | 149 | 113.1 | 0.0 | –1.5 | +11.6 |
| of which cow milk (2) | 139 | 112.9 | 0.0 | –1.6 | +11.9 |
| Eggs | 15 | 111.9 | +2.9 | +16.9 | –30.9 |
- (1) Including vegetables for industry.
- (2)The price for October is not yet known and therefore is estimated by carrying forward the seasonally adjusted price from September
- Sources: INSEE - SSP (ministry of agriculture)
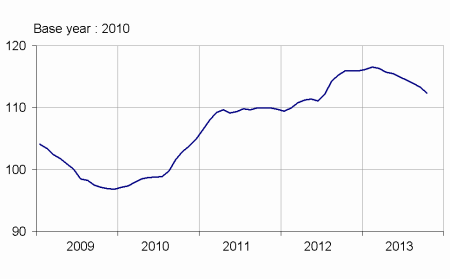
Purchase prices of the means of agricultural production decreased in October.
The prices of intermediate consumptions continued to dip in October (-1.1 %), mainly due to energy, fertilisers and food for animals. Investment prices were almost stable.
graphiquemeans – Purchase price of the means of agricultural production
- Sources : INSEE et SSP (ministry of agriculture)
tableauTab2 – Indices of purchase prices of the means of agricultural production (IPAMPA)
| weights | Oct. 2013 | Variation as % over | |||
|---|---|---|---|---|---|
| a month | 3 months | a year | |||
| Total input | 1000 | 112.3 | –0.9 | –1.8 | –3.1 |
| Intermediate consumptions | 755 | 114.6 | –1.1 | –2.2 | –4.2 |
| Energy (1) | 102 | 118.9 | –2.4 | –0.1 | –4.5 |
| Seeds | 67 | 108.6 | +0.1 | +0.6 | +2.6 |
| Fertilisers and soil improvers | 100 | 114.3 | –2.6 | –4.8 | –11.8 |
| Plant protection products | 83 | 101.3 | +0.1 | +0.3 | +0.2 |
| Animal feed | 211 | 126.5 | –1.5 | –5.4 | –7.9 |
| Veterinary expenses | 50 | 109.7 | +0.2 | +0.5 | +3.3 |
| Small equipment and tools | 16 | 109.9 | +0.5 | +0.4 | +2.7 |
| Maintenance of materials | 65 | 108.9 | +0.1 | +0.1 | +2.3 |
| Maintenance of buildings | 9 | 106.7 | –0.1 | –0.1 | +0.7 |
| Other goods and services | 52 | 102.2 | 0.0 | 0.0 | 0.0 |
| Goods and services contributing to investment | 245 | 105.4 | –0.1 | –0.4 | +0.8 |
| Material | 193 | 105.2 | –0.2 | –0.2 | +1.2 |
| Tractors | 82 | 104.8 | –0.2 | –0.5 | +0.4 |
| Machinery and plant for cultivation | 37 | 105.8 | –0.1 | +0.4 | +3.1 |
| Machinery and plant for harvesting | 43 | 106.0 | –0.3 | –0.3 | +1.3 |
| Utility vehicles | 19 | 103.3 | +0.1 | +0.1 | +1.2 |
| Total input | 52 | 106.3 | –0.1 | –1.0 | –0.6 |
- (1) The repayment of the domestic tax on energy products (TICPE) benefiting farmers has been applied in advance for the year 2013
- Sources: INSEE - SSP (ministry of agriculture)
Documentation
Methodology (pdf,122 Ko)
Pour en savoir plus
Time series : Indices of agricultural prices
