


 13 December 2013
2013- n° 286In November 2013, slight decrease in oil prices Prices of oil and raw material imports - November 2013
13 December 2013
2013- n° 286In November 2013, slight decrease in oil prices Prices of oil and raw material imports - November 2013
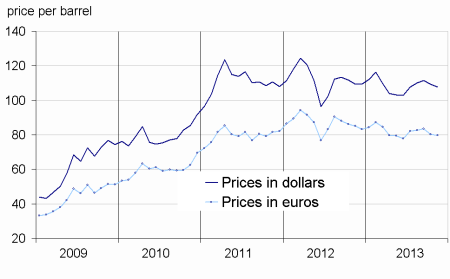
In November, the price of crude oil in euro terms fell moderately (-0.4%), to stand at €79.8 per barrel of Brent. Conversely, prices of imported commodities except energy in euros rose slightly (+1.2%), due to a rise both in raw food materials prices (+1.9%) and in industrial raw materials prices (+0.8%).
In November, the price of crude oil in euro terms fell moderately (-0.4%), to stand at €79.8 per barrel of Brent. Conversely, prices of imported commodities except energy in euros rose slightly (+1.2%), due to a rise both in raw food materials prices (+1.9%) and in industrial raw materials prices (+0.8%).
Slight drop in oil prices in euros
In November, the price of crude oil from the North Sea (Brent) in dollars dipped a little (-1.5% after -2.0%). On account of the decline in the Libyan exportations and despite the mid-term agreement on the Iranian nuclear outlook, it nonetheless remained relatively high ($107.7 on average). In euros, the drop in the Brent price was less marked (-0.4% from –4.0%) because the euro depreciated slightly against the dollar (-1.1%).
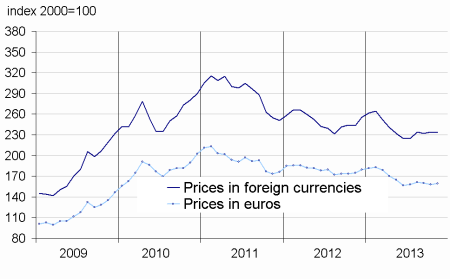
Slight rise in industrial raw materials prices
In November, prices of industrial raw materials in euros increased moderately (+0.8% after -1.2% in October). Mineral raw materials prices held steady (-0.1% after –1.4%). Prices of non-ferrous metals further decreased (-1.7% after –4.4%), in particular those of gold (-2.0% after -4.5%) and silver (-4.2% after -4.9%), notably because of the drop in Indian gold importations. Prices of non-ferrous metals dipped as well (-1.2% after -0.5%), especially those of aluminum (–2.4% after +0.8%) whose inventories were high and output in excess. Conversely, prices of iron ore climbed (+4.0% after -3.3%), supported by a high Chinese demand. Prices of agricultural raw materials rose slightly (+3.6% after -0.6%) driven by an increase in wood pulp prices (+2.9% from -0.4%) and in sawn softwood (+7.2% after +1.7%).
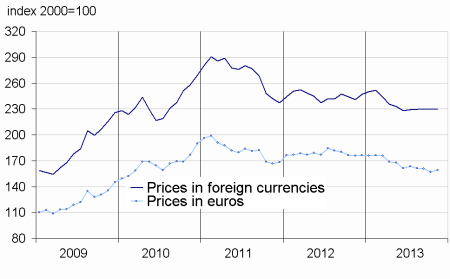
Raw food materials prices rise
In November, prices of raw food materials increased (+1.9%) following a fall in October (-3.7%). This could be explained by a significant rise in palm oil prices (+7.3% from +2.9%) : a high worldwide demand for biodiesel supply and lower-than-expected yield in South-East Asia (due to heavy rainfalls) made prices soar. Prices of tropical foodstuffs rose slightly (+0.2% after -0.2%). Prices of arabica (-5.3%) and robusta (-3.8%) dropped due to a favourable crop start , but this decline
was offset by the rise in tea prices (+7.3%).
tableautabpetrole – Oil and petroleum products
| Prices | Change (%) | |||
|---|---|---|---|---|
| of last month | over the last month | over the last 3 months | over the last 12 months | |
| Brent in $ per barrel | 107,7 | –1,5 | –2,2 | –1,5 |
| Brent in € per barrel | 79,8 | –0,4 | –3,5 | –6,3 |
| Gasoline €/L | 0,47 | –3,5 | –19,3 | –20,1 |
| Gas Oil | 678,8 | –0,2 | –3,2 | –7,0 |
| Heavy fuel | 443,4 | 0,7 | –3,2 | –6,7 |
| Naphtha | 687,0 | 3,8 | 0,7 | –5,3 |
- Prices are in euros per tonne unless otherwise specified
- Source : Insee
tableautabmatprem – Imported raw materials (excluding energy) in euros
| Index | Changes (%) | |||
|---|---|---|---|---|
| over the last month | over the last 3 months | over the last 12 months | ||
| Food total | 176,3 | 1,9 | –0,9 | –10,4 |
| Tropical foodstuffs | 144,5 | 0,2 | 1,1 | –10,9 |
| Oil seeds, vegetable oils | 228,3 | 3,5 | –1,6 | –9,8 |
| Cereals | 148,1 | –0,8 | –12,6 | –34,5 |
| Sugar | 147,2 | –4,6 | 4,8 | –12,6 |
| Beef meat | 118,4 | 3,1 | 1,6 | 2,9 |
| Industrial raw materials | 159,3 | 0,8 | –1,4 | –9,0 |
| Agricultural raw materials | 108,5 | 3,6 | 5,5 | –0,2 |
| Natural Fibers | 119,4 | –3,9 | –8,0 | –1,4 |
| Natural rubber | 242,0 | –1,0 | –4,0 | –21,7 |
| Hides | 90,2 | 13,6 | 9,7 | 13,9 |
| Wood pulp | 90,1 | 2,9 | 3,1 | 5,5 |
| Tropical wood | 99,5 | 1,3 | 2,6 | –4,0 |
| Sawn softwood | 102,3 | 7,2 | 15,6 | 7,6 |
| Minerals | 186,8 | –0,1 | –3,6 | –11,6 |
| Iron ore | 748,0 | 4,0 | –1,8 | 7,8 |
| Non-ferrous metals | 138,7 | –1,2 | –3,8 | –14,0 |
| Precious metals | 225,7 | –1,7 | –6,1 | –28,6 |
| All commodities | 159,1 | 1,2 | –1,2 | –9,5 |
- Source : Insee
graphiqueG_petrole_ang – Oil
- Source : Insee
graphiqueG_alim_ang – Food
- Source : Insee
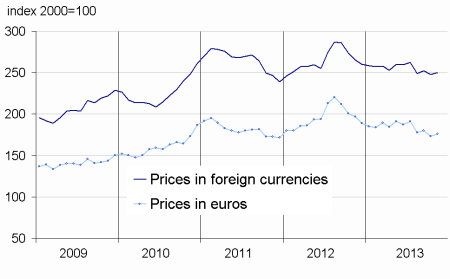
graphiqueG_ensemble_ang – All commodities
- Source : Insee
graphiqueG_indus_ang – Industrial raw materials
- Source : Insee
Pour en savoir plus
Time series : Raw materials prices
