


 20 December 2013
2013- n° 294Overall producer prices of agricultural products increased in November Indices of agricultural prices - November 2013
20 December 2013
2013- n° 294Overall producer prices of agricultural products increased in November Indices of agricultural prices - November 2013
Overall producer prices of agricultural products rose slightly in November compared to last month (+0.7 %) ; they dropped by 6.4% over one year.
Overall producer prices of agricultural products rose slightly in November compared to last month (+0.7 %) ; they dropped by 6.4% over one year.
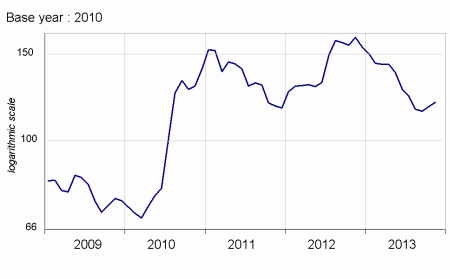
Cereal prices have rallied for two months, going up by 1.9 % in November. Wheat prices increased due to bearish estimations for the global crop. Maïze prices hardly increased: its demand was bullish, noticeably driven by China, but its supply jumped as well, fed by the record crop in the United-States, the first global producer.
graphiquecereal – Producer prices of cereals
Oleaginous prices went up again in November (+2.1 %). Prices for both rape and soy rose, as these two goods are partially substituable. There were still uncertainties regarding the next crop of soy in South-America; its demand was driven by China.
Wine prices were stable in November, as the dip in PDO wine prices was offset by the leap in other wines prices.
Potato prices noticeably decreased compared to last year (-8.9 %), although remaining at a high level. The crop in North-Western Europe rose only slightly as a result of the tumble in yields in Germany.
Fresh fruits prices dropped year-over-year (–10.3 %). Apple and pear prices decreased as their production rose sharply this year.
graphiquevegetable – Producer price of fresh vegetables
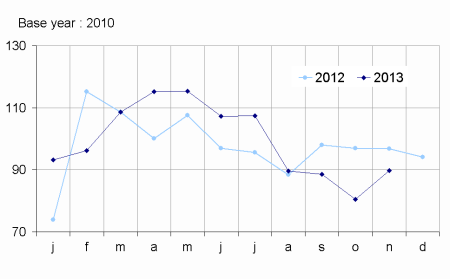
Fresh vegetables prices decreased year-over-year (–7.4 %). Tomatoes and lettuces sold less easily due to the sharp cooling in November. Conversely this phenomenon led to a more significant consumption of leeks, carrots and chicories, whose prices were high.
graphiquepig – Producer prices of pigs and large cattle
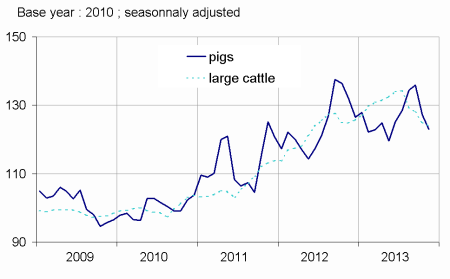
On a seasonally adjusted basis, animal prices dipped in November (-1.1 %). Big cattle and calve prices were almost stable over one year; the slaughters were run down to balance a dull demand. Pig prices continued to decrease as the result of the German competition. Egg prices have rallied for three months (+25.3 %), after an over-production period.
tableauTab1 – Indices of producer prices of agricultural products (IPPAP)
| Variation as % over | |||||
|---|---|---|---|---|---|
| weights | Nov. 2013 | a month | 3 months | a year | |
| raw | Seasonally adjusted data | raw | |||
| Agricultural goods output | 1000 | 118.2 | +0.7 | –0.4 | –6.4 |
| excluding fruits and vegetables | 900 | 119.9 | +0.3 | –0.2 | –6.3 |
| Crop output (excluding fruits and vegetables) | 502 | 120.7 | +1.0 | –0.1 | –12.1 |
| Cereals | 190 | 119.8 | +1.9 | +3.3 | –26.2 |
| of which soft wheat | 113 | 122.2 | +2.7 | +9.7 | –25.0 |
| grain maize | 42 | 106.4 | +0.5 | –9.6 | –31.9 |
| Potatoes | 26 | 169.2 | /// | /// | –8.9 |
| Wines | 171 | 123.4 | 0.0 | +4.1 | +9.2 |
| Protected designation of origin | 135 | 123.0 | –0.4 | +4.3 | +10.6 |
| other wines | 36 | 124.7 | +1.3 | +3.4 | +4.2 |
| Oleaginous | 49 | 101.3 | +2.1 | +4.8 | –22.2 |
| Horticultural products | 31 | 108.8 | 0.0 | –0.7 | +1.0 |
| Other crop products | 34 | 114.9 | +2.0 | –1.6 | –3.9 |
| Fruits and vegetables (1) | 100 | 102.0 | /// | /// | –8.2 |
| Fresh vegetables | 51 | 89.7 | /// | /// | –7.4 |
| Fresh fruits | 41 | 119.6 | /// | /// | –10.3 |
| Animal output | 398 | 118.9 | –0.5 | –0.3 | +2.4 |
| Animals | 234 | 119.8 | –1.1 | –4.3 | –2.3 |
| of which large cattle | 96 | 123.7 | –0.8 | –4.2 | –0.5 |
| calves | 26 | 109.1 | +2.5 | +4.1 | –0.4 |
| pigs | 54 | 119.8 | –3.3 | –8.5 | –6.9 |
| sheep | 10 | 121.3 | –0.1 | –5.5 | +8.8 |
| poultry | 44 | 117.1 | –0.8 | –3.2 | –3.9 |
| of which chicken | 18 | 118.2 | –0.8 | –3.4 | –3.3 |
| Milk | 149 | 117.6 | 0.0 | +4.5 | +16.6 |
| of which cow milk (2) | 139 | 117.7 | 0.0 | +4.8 | +17.3 |
| Eggs | 15 | 117.5 | +4.9 | +25.3 | –29.4 |
- (1) Including vegetables for industry.
- (2)The price for November is not yet known and therefore is estimated by carrying forward the seasonally adjusted price from October
- Sources: INSEE - SSP (ministry of agriculture)
Purchase prices of the means of agricultural production decreased in November.
The prices of intermediate consumptions dipped in November (-0.4 %). The fertilisers and animal feed were less expensive than last year by about 10%. Investment prices were stable.
graphiquemeans – Purchase price of the means of agricultural production

tableauTab2 – Indices of purchase prices of the means of agricultural production (IPAMPA)
| weights | Nov. 2013 | Variation as % over | |||
|---|---|---|---|---|---|
| a month | 3 months | a year | |||
| Total input | 1000 | 112.0 | –0.3 | –1.6 | –3.4 |
| Intermediate consumptions | 755 | 114.1 | –0.4 | –2.1 | –4.6 |
| Energy (1) | 102 | 119.2 | +0.3 | –1.3 | –2.5 |
| Seeds | 67 | 108.7 | +0.1 | +0.5 | +2.8 |
| Fertilisers and soil improvers | 100 | 112.4 | –1.6 | –5.6 | –13.3 |
| Plant protection products | 83 | 101.6 | +0.2 | +0.5 | +0.8 |
| Animal feed | 211 | 125.5 | –0.8 | –4.1 | –9.5 |
| Veterinary expenses | 50 | 109.8 | 0.0 | +0.5 | +3.6 |
| Small equipment and tools | 16 | 110.0 | –0.1 | 0.0 | +2.4 |
| Maintenance of materials | 65 | 109.1 | +0.1 | +0.2 | +2.3 |
| Maintenance of buildings | 9 | 106.8 | +0.1 | +0.1 | +0.9 |
| Other goods and services | 52 | 101.3 | 0.0 | –0.1 | –0.8 |
| Goods and services contributing to investment | 245 | 105.6 | 0.0 | 0.0 | +1.0 |
| Material | 193 | 105.4 | 0.0 | +0.2 | +1.3 |
| Tractors | 82 | 104.8 | 0.0 | –0.2 | +0.2 |
| Machinery and plant for cultivation | 37 | 105.7 | +0.1 | –0.1 | +3.0 |
| Machinery and plant for harvesting | 43 | 107.4 | +0.1 | +1.1 | +2.1 |
| Utility vehicles | 19 | 103.1 | –0.2 | 0.0 | +0.8 |
| Total input | 52 | 106.2 | –0.1 | –0.5 | 0.0 |
- (1) The repayment of the domestic tax on energy products (TICPE) benefiting farmers has been applied in advance for the year 2013
- Sources: INSEE - SSP (ministry of agriculture)
Documentation
Methodology (pdf,122 Ko)
Pour en savoir plus
Time series : Indices of agricultural prices
