


 29 November 2013
2013- n° 272In October, household consumption of goods decreased (-0.2%) because of a sharp decrease
in expenditure on energy products Household consumption expenditure on goods - October 2013
29 November 2013
2013- n° 272In October, household consumption of goods decreased (-0.2%) because of a sharp decrease
in expenditure on energy products Household consumption expenditure on goods - October 2013
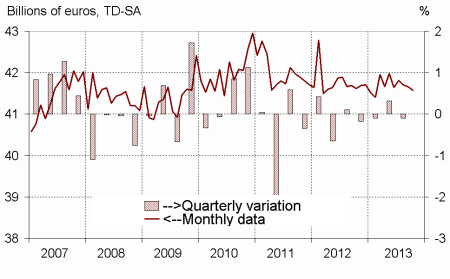
In October, household expenditure on goods dropped by 0.2 % in volume*, after decreasing by 0.1% in September. This decline was due to a decrease in expenditure on energy products (–4.9%).
In October, household expenditure on goods dropped by 0.2 % in volume*, after decreasing by 0.1% in September. This decline was due to a decrease in expenditure on energy products (–4.9%).
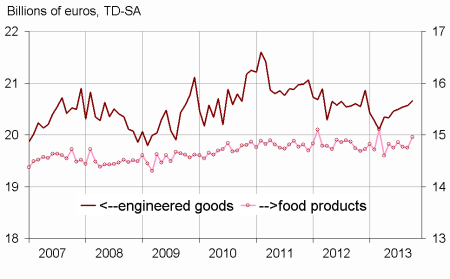
Engineered goods : accelerating
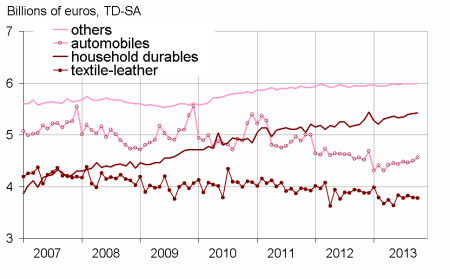
Durables : rising again
Household expenditure on durables rose again in October (+0.8% after +0.7% in September). This result can be partially explained by an acceleration in car purchases (+1.5%, after +0.8%), as households may have anticipated a reduction in incentive for the purchase of green cars in November and strenghtening of penalties on the purchase of polluting cars next January. Purchases on household durables increased as well (+0.1%, after +0.4%).
Textile-leather : decreasing anew
In October, purchases on clothing, textile and leather decreased for the second month in a row (–0.3% after –0.9% in September).
Other engineered goods : slightly increasing
After having remained steady from July to September, consumption expenditure on other engineered goods increased slightly in October (+0.2%), especially because purchases on hardware bounced back.
[* Volumes are chained and all figures are trading days and seasonally adjusted.]
graphiquegraph1_new_ang – Total consumption of goods
graphiquegraph2_new_ang – Food and engineered goods
graphiquegraph3_new_ang – Breakdown of engineered goods
Food products : rebound
After two consecutive declining months (–0.6% in August and –0.2% in September), consumption in food products bounced back in October (+1.4%), a rebound mainly attributable to expenditure on tobacco products.
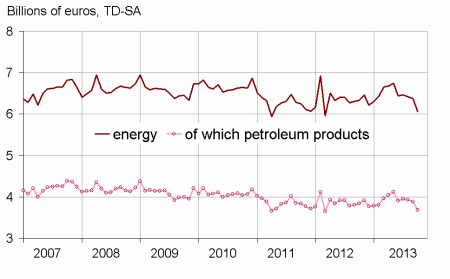
Energy : significant decline
After a slight decrease in September (–0.7%), household consumption of energy products dropped sharply in October (–4.9%), which reflected the impact of above average temperatures on heating expenditure. Moreover, fuel expenditure decreased sharply.
The slight decrease in September is confirmed
The decrease of household consumption on goods is still estimated at –0.1% in September, as it was for the previous publication.
Some minor revisions, offsetting each other as a whole, come from the reestimation of seasonal adjustment models and from the integration of new information, in particular the integration of the September turnover index.
| August | Sept. | Oct. | Oct.13/ | |
|---|---|---|---|---|
| 2013 | 2013 | 2013 | Oct.12 | |
| Food products | 14.771 | 14.745 | 14.955 | |
| Change (%) | –0.6 | –0.2 | 1.4 | 1.4 |
| Engineered goods | 20.537 | 20.569 | 20.654 | |
| Change (%) | 0.2 | 0.2 | 0.4 | 0.3 |
| Of which: | ||||
| Automobiles | 4.462 | 4.498 | 4.564 | |
| Change (%) | –0.5 | 0.8 | 1.5 | 0.0 |
| Household durables | 5.391 | 5.414 | 5.418 | |
| Change (%) | 1.0 | 0.4 | 0.1 | 4.2 |
| Textile-leather | 3.821 | 3.789 | 3.778 | |
| Change (%) | 1.1 | –0.9 | –0.3 | –3.7 |
| Other engineered goods | 5.983 | 5.983 | 5.997 | |
| Change (%) | 0.0 | 0.0 | 0.2 | 0.9 |
| Energy | 6.416 | 6.374 | 6.064 | |
| Change (%) | –0.7 | –0.7 | –4.9 | –4.1 |
| Including petroleum products | 3.925 | 3.891 | 3.688 | |
| Change (%) | –0.7 | –0.9 | –5.2 | –4.1 |
| Total | 41.709 | 41.659 | 41.575 | |
| Change (%) | –0.3 | –0.1 | –0.2 | –0.1 |
| Manufactured goods | 36.051 | 35.998 | 36.250 | |
| Change (%) | –0.2 | –0.1 | 0.7 | 0.6 |
graphiquegraph4_new_ang – Energy
graphiquetab1_eng – Household consumption expenditure on goods
Documentation
Methodology (pdf,23 Ko)
Pour en savoir plus
