


 16 September 2011
2011- n° 222An increase in enterprise births in August 2011 Enterprise births - Auguste 2011
16 September 2011
2011- n° 222An increase in enterprise births in August 2011 Enterprise births - Auguste 2011
In August 2011, the number of enterprise births increased compared to July: +27.8% for enterprise births excluding self-managed enterprises (seasonally and working-day adjusted data); +7.5% when the number of self-managed enterprises (raw data) is added.
Warning : From the August issue, only enterprise births data excluding self-managed enterprises (SME) are seasonally adjusted. In order to get the total of enterprise births, the raw number of SME is added. The SME time series is too short to be properly deseasonalized.
In August 2011, the number of enterprise births increased compared to July: +27.8% for enterprise births excluding self-managed enterprises (seasonally and working-day adjusted data); +7.5% when the number of self-managed enterprises (raw data) is added.
-9.1% year-on-year (quarterly basis)
The amount of entries, added up June, July and August 2011, decreased by 9.1% compared to the same quarter one year before.
The sectors that most contributed to that decrease were service activities and wholesale and retail trade.
-10% year-on-year (twelve months basis)
During the last twelve months, the number of births decreased by 10.0% year-on-year.
190,845 self-managed enterprises since the beginning of 2011
From January to August 2011, one out of every two births enterprises were self-managed enterprises (190,845).
tableautab0EN – Self-managed entreprise births
| May 2011 | June 2011 | July 2011 | Aug. 2011 |
|---|---|---|---|
| 25 328 | 24 746 | 20 656 | 18 523 |
- Source: INSEE (Sirene)
tableautab1EN – Enterprise births by month
| May 2011 | June 2011 | July 2011 | Aug. 2011 | |
|---|---|---|---|---|
| Excl. self-managed enterprises (sa-wda *) | 23 615 | 21 026 | 18 138 | 23 174 |
| Variation [m-o-m] % | 28.5 | -11.0 | -13.7 | 27.8 |
| Incl. self-managed enterprises (in raw data) | 48 943 | 45 772 | 38 794 | 41 697 |
| Variation [m-o-m] % | 14.6 | -6.5 | -15.2 | 7.5 |
- * Seasonally and working-day adjusted data
- Source: INSEE (Sirene)
tableautab2EN – Enterprise births by type
| Moving total % change* | Moving total | Moving total | ||
|---|---|---|---|---|
| over 3 months | over 12 months | January- August 2011 | January- August 2010 | |
| Total | -9.1 | -10.0 | 364 891 | 421 205 |
| Companies | -3.7 | 1.9 | 111 781 | 109 580 |
| Individual enterprises | -11.3 | -14.1 | 253 110 | 311 625 |
| Of which self-managed | -10.0 | -16.5 | 190 845 | 244 731 |
- * Total of enterprises births during the last 3 or 12 months compared with the same months a year earlier
- // = meaningless
- Source: INSEE (Sirene)
graphiqueGraph1EN – Enterprise births
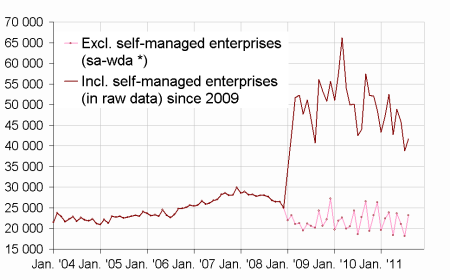
- * Seasonally and working-day adjusted data
- Source: INSEE (Sirene)
Pour en savoir plus
Time series : Business demography
