


 23 December 2011
2011- n° 315In Q3, French GDP accelerated (+0.3% after –0.1%) while households’ purchasing power
was flat (+0.0% after +0.6%) Quarterly national accounts - detailed figures - 3rd quarter
23 December 2011
2011- n° 315In Q3, French GDP accelerated (+0.3% after –0.1%) while households’ purchasing power
was flat (+0.0% after +0.6%) Quarterly national accounts - detailed figures - 3rd quarter
In 2011 Q3, French GDP* renewed with growth increasing by 0.3% after a step back in Q2 (–0.1%).
In 2011 Q3, French GDP* renewed with growth increasing by 0.3% after a step back in Q2 (–0.1%).
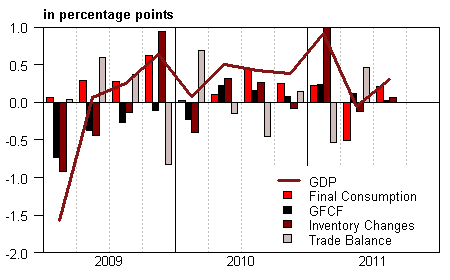
Households’ consumption expenditure increased anew (+0.3% after –1.0%). Gross fixed capital formation’s rise continued though less rapidly than the previous quarter (+0.2% after +0.6%). Overall, total domestic demand (excluding changes in inventories) drove GDP up: +0.2 point after –0.4 point.
Imports upturned (+0.7% after –1.0%) and increased almost at the same pace as exports (+0.8% after +0.7%). Hence, foreign trade balance was neutral on GDP growth, after contributing for +0.5 point the previous quarter.
Finally, changes in inventories contributed positively to GDP growth: +0.1 point after –0.4 point in Q2.
GDP growth estimation is scaled down
GDP growth estimation for Q3 is scaled down by 0.1 point, from +0.4% in the previous publication to +0.3%. This revision is due to the revision of some indicators available in First Results (notably for production) and to the integration of data released since then (mainly the turnover indices for September in replacement of extrapolations).
graphiqueGraph1 – GDP and its main components
tableauTab1 – GOODS AND SERVICES: SUPPLY AND USES CHAIN-LINKED VOLUMES
| 2010 Q4 | 2011 Q1 | 2011 Q2 | 2011 Q3 | 2010 | 2011 (ovhg) | |
|---|---|---|---|---|---|---|
| GDP | 0.4 | 0.9 | -0.1 | 0.3 | 1.4 | 1.7 |
| Imports | -0.1 | 3.0 | -1.0 | 0.7 | 8.3 | 5.4 |
| Households' consumption expenditure | 0.4 | 0.2 | -1.0 | 0.3 | 1.3 | 0.3 |
| General government's consumption expenditure | 0.1 | 0.4 | 0.1 | 0.2 | 1.2 | 0.8 |
| GFCF | 0.4 | 1.2 | 0.6 | 0.2 | -1.4 | 2.7 |
| of which Non financial corporated and unincorporated enterprises | 0.8 | 1.9 | 0.3 | -0.6 | 2.0 | 3.8 |
| Households | 0.7 | -0.2 | 1.2 | 1.3 | -1.4 | 2.7 |
| General government | -1.4 | 1.5 | 0.7 | 0.5 | -9.7 | -0.3 |
| Exports | 0.5 | 1.3 | 0.7 | 0.8 | 9.3 | 4.5 |
| Contributions : | ||||||
| Internal demand excluding inventory changes | 0.3 | 0.4 | -0.4 | 0.2 | 0.8 | 0.9 |
| Inventory changes | -0.1 | 1.0 | -0.1 | 0.1 | 0.5 | 1.1 |
| Net foreign trade | 0.1 | -0.5 | 0.5 | 0.0 | 0.1 | -0.3 |
tableauTab2 – Sectoral accounts
| 2010 Q4 | 2011 Q1 | 2011 Q2 | 2011 Q3 | 2010 | 2011 (ovhg) | |
|---|---|---|---|---|---|---|
| Profit ratio of NFC* (level) | 29.7 | 29.8 | 29.0 | 29.0 | 30.1 | |
| Household purchasing power | 0.4 | 0.1 | 0.6 | 0.0 | 0.8 | 1.3 |
- *NFC: non-financial corporations
tableauTab3 – GDP and components : prices indices
| 2010 Q4 | 2011 Q1 | 2011 Q2 | 2011 Q3 | 2010 | 2011 (ovhg) | |
|---|---|---|---|---|---|---|
| GDP | 0.1 | 0.6 | 0.4 | 0.4 | 0.8 | 1.5 |
| Imports | 1.5 | 3.4 | 0.1 | 0.3 | 4.0 | 5.0 |
| Cons. Exp. : | ||||||
| - Households | 0.5 | 0.7 | 0.6 | 0.4 | 1.2 | 1.9 |
| - GG* | 0.3 | 0.3 | 0.2 | 0.2 | 1.5 | 1.0 |
| Total GFCF | 0.3 | 1.1 | 0.7 | 0.4 | 1.2 | 2.3 |
| - of which Households | 0.5 | 0.9 | 1.4 | 0.7 | 2.3 | 3.1 |
| - of which NFE | 0.1 | 1.1 | 0.4 | 0.3 | 0.6 | 1.8 |
| - of which GG | 0.3 | 1.9 | 0.6 | 0.4 | 1.9 | 3.3 |
| Exports | 0.9 | 1.8 | 0.4 | 0.3 | 1.7 | 3.5 |
- *GG: General Government
tableauTab4 – Manufactured goods : supply and uses in volume
| 2010 Q4 | 2011 Q1 | 2011 Q2 | 2011 Q3 | 2010 | 2011 (ovhg) | |
|---|---|---|---|---|---|---|
| Industrie’s production | 0.5 | 2.8 | -0.7 | -0.4 | 4.3 | 2.9 |
| - of which value added | 1.3 | 2.0 | -0.3 | -0.1 | 3.3 | 2.9 |
| Imports | 1.1 | 3.0 | -0.7 | 0.3 | 11.0 | 6.3 |
| Intermediate uses | 0.7 | 1.8 | -0.3 | -0.2 | 3.1 | 2.5 |
| Cons. Exp. : | ||||||
| - of households | 0.7 | 0.6 | -2.1 | -0.3 | 1.3 | 0.1 |
| - of GG | 1.1 | 0.7 | 0.3 | 1.0 | 5.3 | 3.5 |
| Total GFCF | 3.2 | 2.9 | 1.4 | -1.0 | 6.7 | 8.5 |
| - of which NFC | 3.6 | 3.2 | 1.5 | -1.2 | 8.3 | 9.5 |
| - of which GG | 0.0 | 0.5 | 0.5 | 0.4 | -3.8 | 0.3 |
| Exports | 0.1 | 0.7 | 0.7 | 0.7 | 11.0 | 3.9 |
| Inventory changes (contribution) | 0.1 | 2.5 | -0.3 | -0.1 | 1.6 | 2.5 |
tableauTab5 – Households’ disposable income and ratios of households’ account
| 2010 Q4 | 2011 Q1 | 2011 Q2 | 2011 Q3 | 2010 | 2011 (ovhg) | |
|---|---|---|---|---|---|---|
| HDI | 0.9 | 0.9 | 1.2 | 0.4 | 2.0 | 3.3 |
| Household purchasing power | 0.4 | 0.1 | 0.6 | 0.0 | 0.8 | 1.3 |
| HDI by cu* (purchasing power) | 0.2 | 0.0 | 0.4 | -0.1 | 0.1 | 0.6 |
| Adjusted HDI (purchasing power) | 0.3 | 0.2 | 0.5 | 0.1 | 0.8 | 1.3 |
| Saving rate (level) | 16.1 | 16.0 | 17.3 | 17.1 | 16.1 | |
| Financial saving rate (level) | 7.0 | 6.9 | 8.1 | 7.8 | 7.0 |
- *cu: consumption unit
tableauTab6 – Ratios of non-financial corporations’ account
| 2010 Q4 | 2011 Q1 | 2011 Q2 | 2011 Q3 | 2010 | |
|---|---|---|---|---|---|
| Profit share | 29.7 | 29.8 | 29.0 | 29.0 | 30.1 |
| Investment ratio | 18.9 | 19.1 | 19.2 | 18.9 | 18.7 |
| Savings ratio | 14.1 | 14.5 | 13.6 | 13.4 | 14.6 |
| Self-financing ratio | 74.5 | 76.2 | 71.2 | 70.6 | 78.3 |
Households’ purchasing power held steady
Households’ disposable income markedly decelerated in Q3 (+0.4% after +1.2%).
As employment and average wage per capita decelerated, wages earned by households increased less rapidly than in Q2 (+0.4% after +0.9%). Social benefits in cash were slightly less dynamic in Q3 (+0.9% after +1.1%). Finally, taxes on income and wealth sharply accelerated (+3.1% after +0.8%). They were buoyed up by budget consolidation measures passed for 2011.
At the same time, consumption prices increased less rapidly than the previous quarter (+0.4% after +0.6%). All in all, households’ purchasing power remained stable in Q3 after an increase of 0.6% in Q2. Taken individually (measured per consumption unit) it declined by 0.1% after a 0.4% rise in the previous quarter.
Households’ consumption in nominal terms bounced (+0.6% after –0.4%) and increased faster than nominal income. Consequently, the savings ratio slightly decreased (from 17.3% to 17.1%), after reaching its highest level since 1983.
Non-financial corporations’ profit ratio levelled down
Non-financial corporations’ value added accelerated this quarter (+0.8% after +0.2%). Wages paid markedly slowed down (+0.7% after +1.3%). On the one hand, employment (+0.2% after +0.5%) and wages per capita (+0.2% after +0.7%) both decelerated. On the other hand, employers’ social contributions remained quite dynamic (+1.7%). Besides, taxes on production grew less rapidly than the previous quarter but were still dynamic (+1.3% after +2.0%). All in all, value added growth was close to that of wages and taxes altogether. As a consequence, gross operating surplus increased at the same rate (+0.8% after –2.8%). Non-financial corporations’ profit ratio levelled down at 29.0% in Q3, its lowest level since 1986 , after a 0.8 point drop in the previous quarter.
Pour en savoir plus
