


 28 September 2011
2011- n° 232In Q2 2011, French GDP held steady (0.0% after +0.9%), while households’ purchasing
power accelerated (+0.6% after +0.2%) Quarterly national accounts - detailed figures - 2nd quarter 2011
28 September 2011
2011- n° 232In Q2 2011, French GDP held steady (0.0% after +0.9%), while households’ purchasing
power accelerated (+0.6% after +0.2%) Quarterly national accounts - detailed figures - 2nd quarter 2011
French GDP’s* stability in Q2 2011 is confirmed: 0.0% evolution after a sharp increase in Q1 (+0.9%).
French GDP’s* stability in Q2 2011 is confirmed: 0.0% evolution after a sharp increase in Q1 (+0.9%).
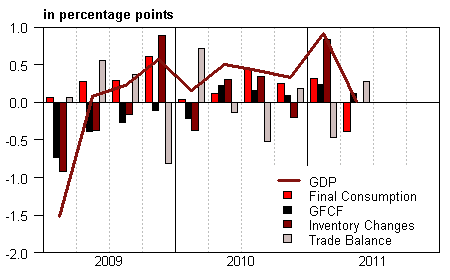
Households’ consumption expenditure stepped back (–0.7% after +0.4%), while gross fixed capital formation (GFCF) grew less rapidly (+0.6% after +1.2%). Overall, total domestic demand (excluding changes in inventories) drove GDP down (–0.3 point after +0.5 point).
Imports decreased (–0.9% after +3.2%), while exports remained stable. Consequently, foreign trade balance contributed positively to GDP growth (+0.3 point after –0.5 point).
In Q2, changes in inventories were neutral on GDP growth, after contributing for +0.8 point in the previous quarter.
GDP growth’s estimation is not revised
GFCF growth’s estimation for Q2 is scaled down by 0.3 point, from +0.9% in the previous release to +0.6%. This revision is due to the integration of information known since the first publication. Other main aggregates are marginally revised and GDP growth estimation remains unchanged.
graphiqueGraph1 – GDP and its main components
tableauTab1 – GOODS AND SERVICES: SUPPLY AND USES CHAIN-LINKED VOLUMES
| 2010 Q3 | 2010 Q4 | 2011 Q1 | 2011 Q2 | 2010 | 2011 (ovhg) | |
|---|---|---|---|---|---|---|
| GDP | 0.4 | 0.3 | 0.9 | 0.0 | 1.4 | 1.5 |
| Imports | 4.2 | -0.4 | 3.2 | -0.9 | 8.3 | 5.1 |
| Households' consumption expenditure | 0.7 | 0.4 | 0.4 | -0.7 | 1.3 | 0.5 |
| General government's consumption expenditure | 0.2 | 0.1 | 0.4 | 0.1 | 1.2 | 0.7 |
| GFCF | 0.8 | 0.4 | 1.2 | 0.6 | -1.4 | 2.7 |
| of which Non financial corporated and unincorporated enterprises | 1.3 | 0.9 | 1.9 | 0.3 | 2.0 | 4.2 |
| Households | 1.7 | 0.8 | -0.1 | 1.3 | -1.4 | 2.4 |
| General government | -1.9 | -1.4 | 1.5 | 0.6 | -9.7 | -0.6 |
| Exports | 2.4 | 0.3 | 1.7 | 0.0 | 9.3 | 3.9 |
| Contributions : | ||||||
| Internal demand excluding inventory changes | 0.6 | 0.3 | 0.5 | -0.3 | 0.8 | 1.0 |
| Inventory changes | 0.3 | -0.2 | 0.8 | 0.0 | 0.5 | 0.9 |
| Net foreign trade | -0.5 | 0.2 | -0.5 | 0.3 | 0.1 | -0.4 |
tableauTab2 – Sectoral accounts
| 2010 Q3 | 2010 Q4 | 2011 Q1 | 2011 Q2 | 2010 | 2011 (ovhg) | |
|---|---|---|---|---|---|---|
| Profit ratio of NFC* (level) | 30.2 | 29.7 | 29.8 | 28.9 | 30.1 | |
| Household purchasing power | 0.6 | 0.4 | 0.2 | 0.6 | 0.8 | 1.3 |
- *NFC : non-financial corporations
tableauTab3 – GDP and components : prices indices
| 2010 Q3 | 2010 Q4 | 2011 Q1 | 2011 Q2 | 2010 | 2011 (ovhg) | |
|---|---|---|---|---|---|---|
| GDP | 0.4 | 0.1 | 0.6 | 0.4 | 0.8 | 1.2 |
| Imports | -0.3 | 1.5 | 3.5 | 0.0 | 4.0 | 4.8 |
| Cons. Exp. : | ||||||
| - Households | 0.2 | 0.5 | 0.8 | 0.6 | 1.2 | 1.8 |
| - GG* | 0.2 | 0.3 | 0.3 | 0.3 | 1.5 | 0.9 |
| Total GFCF | 0.2 | 0.3 | 1.1 | 0.4 | 1.2 | 1.9 |
| - of which Households | 0.5 | 0.5 | 0.9 | 0.5 | 2.3 | 2.1 |
| - of which NFE | 0.0 | 0.2 | 1.1 | 0.4 | 0.6 | 1.7 |
| - of which GG | 0.1 | 0.3 | 1.9 | 0.5 | 1.9 | 3.0 |
| Exports | 0.7 | 0.9 | 1.8 | 0.4 | 1.7 | 3.3 |
tableauTab4 – Manufactured goods : supply and uses in volume
| 2010 Q3 | 2010 Q4 | 2011 Q1 | 2011 Q2 | 2010 | 2011 (ovhg) | |
|---|---|---|---|---|---|---|
| Industrie’s production | 0.1 | 0.5 | 2.9 | -0.4 | 4.3 | 3.4 |
| - of which value added | 0.0 | 1.2 | 1.9 | 0.1 | 3.3 | 3.2 |
| Imports | 4.5 | 0.5 | 3.3 | -0.7 | 11.0 | 6.3 |
| Intermediate uses | 0.1 | 0.7 | 1.8 | -0.2 | 3.1 | 2.7 |
| Cons. Exp. : | ||||||
| - of households | 1.5 | 0.8 | 0.6 | -1.9 | 1.3 | 0.3 |
| - of GG | 1.1 | 1.2 | 0.6 | 0.2 | 5.3 | 2.9 |
| Total GFCF | 3.1 | 3.2 | 3.1 | 1.4 | 6.7 | 9.1 |
| - of which NFC | 3.6 | 3.6 | 3.3 | 1.5 | 8.3 | 10.1 |
| - of which GG | -0.8 | 0.0 | 0.5 | 0.5 | -3.8 | 0.1 |
| Exports | 3.2 | -0.2 | 1.5 | 0.0 | 11.0 | 3.8 |
| Inventory changes (contribution) | 0.4 | -0.2 | 2.1 | 0.1 | 1.6 | 2.4 |
tableauTab5 – Households’ disposable income and ratios of households’ account
| 2010 Q3 | 2010 Q4 | 2011 Q1 | 2011 Q2 | 2010 | 2011 (ovhg) | |
|---|---|---|---|---|---|---|
| HDI | 0.8 | 0.9 | 0.9 | 1.2 | 2.0 | 3.0 |
| Household purchasing power | 0.6 | 0.4 | 0.2 | 0.6 | 0.8 | 1.3 |
| HDI by cu* (purchasing power) | 0.4 | 0.2 | 0.0 | 0.4 | 0.1 | 0.7 |
| Adjusted HDI (purchasing power) | 0.5 | 0.3 | 0.2 | 0.5 | 0.8 | 1.2 |
| Saving rate (level) | 16.1 | 16.1 | 15.9 | 17.0 | 16.1 | |
| Financial saving rate (level) | 7.0 | 6.9 | 6.7 | 7.8 | 7.0 |
- * cu : consumption unit
tableauTab6 – Ratios of non-financial corporations’ account
| 2010 Q3 | 2010 Q4 | 2011 Q1 | 2011 Q2 | 2010 | |
|---|---|---|---|---|---|
| Profit share | 30.2 | 29.7 | 29.8 | 28.9 | 30.1 |
| Investment ratio | 18.8 | 18.9 | 19.1 | 19.2 | 18.7 |
| Savings ratio | 14.6 | 13.9 | 14.2 | 13.4 | 14.6 |
| Self-financing ratio | 77.7 | 73.7 | 74.4 | 69.9 | 78.3 |
Households’ purchasing power accelerated
In Q2 2011, households disposable income (HDI) increased more rapidly than in Q1 (+1.2% after +0.9%). This acceleration is mainly due to the deceleration of taxes on income and wealth, which renewed with a more moderate growth after a rebound in Q1 (+0.6% after +3.3%). Wages remained dynamic, though less than in Q1 (+0.9% after +1.1%). Social benefits in cash also remained dynamic (+1.0% after +0.9%).
Consumption prices decelerated (+0.6% after +0.8%), in particular due to fuel prices. All in all, households’ purchasing power increased in Q2 (+0.6% after +0.2%). Per consumption unit, it increased as well (+0.4%), after being stable in Q1.
Despite households’ disposible income growth, consumption in nominal terms decreased (–0.2% after +1.1%). As a consequence, households’ savings ratio markedly increased to reach 17.0% (after +15.9%), its highest level since summer 2009.
Non-financial corporations profit ratio markedly decreased
Non-financial corporations’ nominal value added markedly decelerated (+0.2% after +2.0%). Yet, wages paid (including employers’ social contributions) remained dynamic (+1.3% after +1.5%). Their slight deceleration is imputable to that of employment (+0.4% after +0.5%) and wage per capita (+0.7% after +1.0%). After a sharp increase in the previous quarter, taxes on production remained dynamic (+2.0% after +4.6%).
All in all, the increase of value added has been much lower than that of wages and taxes altogether: As a consequence gross operation surplus of non-financial corporations decreased (–2.8% after +2.4%).
Consequently, non-financial corporations’ profit ratio decreased by 0.9 point to reach 28.9% this quarter, its lowest level since 1986.
Pour en savoir plus
