


 23 January 2012
2012- n° 24In January 2012, the economic climate in services is almost stable Monthly survey of services - January 2012
23 January 2012
2012- n° 24In January 2012, the economic climate in services is almost stable Monthly survey of services - January 2012
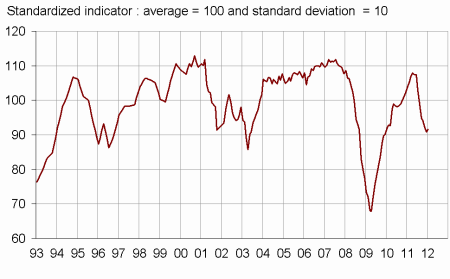
According to the business leaders surveyed in January 2012, the economic situation in services remains almost stable. The business climate synthetic indicator increases by one point, and is 92.
According to the business leaders surveyed in January 2012, the economic situation in services remains almost stable. The business climate synthetic indicator increases by one point, and is 92.
Though business leaders consider that their activity increased the last few months, their activity expectations for the months to come are pessimistic. They expect demand to be less favourable in the next few months.
They consider that their operating balance result increased in the last few months but anticipate a slowdown in the coming months.
The general outlook drops by two points compared with December.
The turning point indicator indicates an unfavourable economic situation.
Less job creations
In services except temporary employment agencies, business leaders consider that the number of job creations decreased in the last few months. They stay pessimistic in their expectations of recruitment.
graphiqueGraph1 – Business climate synthetic indicator
graphiquegraph_retourn – Turning point indicator
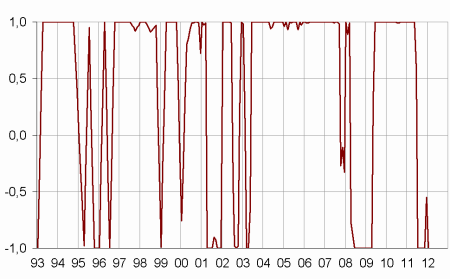
- Note: close to 1 (respectively -1), this indicator indicates a favourable short-term economic situation (respectively unfavourable).
tableauTable_quarter – Economic outlook in the services sector
| Average* | Oct. 11 | Nov. 11 | Dec. 11 | Jan. 12 | |
|---|---|---|---|---|---|
| Business climate synthetic indicator | 100 | 94 | 92 | 91 | 92 |
| General outlook | –5 | –12 | –15 | –17 | –19 |
| Past activity | 4 | –4 | –1 | –1 | 1 |
| Expected activity | 4 | 2 | –3 | –3 | –6 |
| Expected demand | 1 | –3 | –6 | –6 | –12 |
| Business situation | 1 | –5 | –6 | –7 | –6 |
| Past selling prices | –2 | –3 | –4 | –4 | –4 |
| Expected selling prices | –1 | –4 | –4 | –2 | 0 |
| Past employment | 4 | 3 | 8 | 11 | 7 |
| except temporary work agencies | 1 | 1 | –1 | 2 | –1 |
| Expected employment | 3 | 6 | 4 | 1 | –3 |
| except temporary work agencies | 0 | –3 | –1 | –4 | –3 |
| Investments | |||||
| Past investments | 2 | 3 | 6 | 5 | 2 |
| Expected investments | 2 | 0 | –2 | 0 | 3 |
| Operating balance result | |||||
| Past result | –1 | –9 | 0 | ||
| Expected result | –1 | –5 | –9 | ||
| Cash position | –10 | –11 | –11 | ||
| Difficulties of supply and demand | |||||
| difficulties of supply and demand | 9 | 9 | 10 | ||
| difficulties of supply only | 23 | 24 | 23 | ||
| difficulties of demand only | 29 | 31 | 29 | ||
| Difficulties in recruitment | 31 | 22 | 22 |
- * Average of the balances of opinion since 1988
- Source: Insee
Documentation
Methodology (2016) (pdf,158 Ko)
Pour en savoir plus
Time series : Economic outlook surveys – Services
