


 8 April 2011
2011In March 2011, oil prices accelerated Prices of oil and raw material imports - 8th April 2011
8 April 2011
2011In March 2011, oil prices accelerated Prices of oil and raw material imports - 8th April 2011
In March, price of oil in dollars accelerated (+10.6% after +7.4% in February), reaching $114.5 per barrel of Brent. In contrast, prices of foreign currencies for non-energy com-modities imported in France fell(-0,4% after +2.7% in Feb-ruary).
In March, price of oil in dollars accelerated (+10.6% after +7.4% in February), reaching $114.5 per barrel of Brent. In contrast, prices of foreign currencies for non-energy commodities imported in France fell (-0,4% after +2.7% in February).
The price of oil accelerated
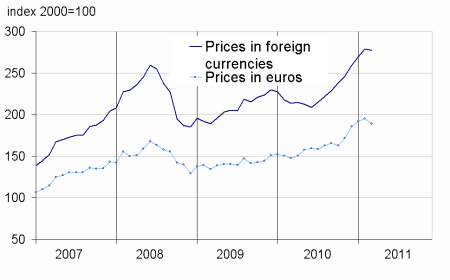
In March, prices in dollars of oil from the North Sea (Brent) accelerated (+10.6% after 7.4% in February). Political unrest in North Africa and the Midlle East continued to weigh on oil prices. In euros, oil prices rose less strongly (+7.8% after +5.1%), due to the appreciation of euro vis-à-vis the dollar (+2.6%).
Prices of imported industrial raw materials fell
In March, prices of industrial raw materials in foreign currencies fell (-0.4% after +2.4%). The prices of mineral raw materials folded up (-0.3% after 3.5%) due to lower prices of the nonferrous metals (-1.4% after +4.3%), including zinc (-5.2%), nickel (-5.1%) and copper (-3.4%). However, precious metals prices accelerated (+7.5% after +4.4%), including silver (+16.4%) and gold (+3.7%). The prices of palladium and platinum folded up (respectively -7.3% and -3.1%).
The prices of agro-industrial raw materials also declined (-0.7%), especially that of natural rubber (-10.0%). Conversely, prices of natural textile fibers continued to grow rapidily (+7.0%), including cotton prices (+7.6%).
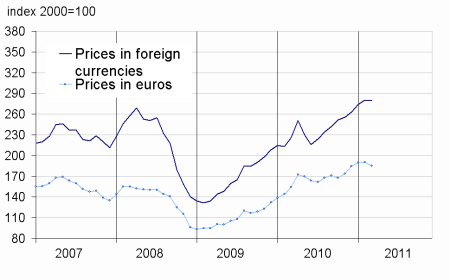
The prices of raw food materials imported declined
In March, prices of raw food in foreign currencies also retreated (-0.4% after +3.4%). The drop in sugar prices accentuated (-11.4% after -1.0%), and cereals prices fell ( -3.6% after +4.3%), including rice (-5.9%). By contrast, prices for beef meat accelerated (+7.2% after +1.7%).
tableautabpetrole – Oil and petroleum products
| Prices | Change (%) | |||
|---|---|---|---|---|
| of last month | over the last month | over the last 3 months | over the last 12 months | |
| Brent in $ per barrel | 114,5 | 10,6 | 24,8 | 45,3 |
| Brent in € per barrel | 81,7 | 7,8 | 17,7 | 40,7 |
| Gasoline | 1052,4 | 20,0 | 26,8 | 36,6 |
| Gas Oil | 972,8 | 10,6 | 27,9 | 45,3 |
| Heavy fuel | 588,2 | 8,9 | 28,2 | 35,3 |
| Naphta | 976,5 | 11,4 | 15,7 | 33,9 |
- Prices are in dollars per tonne unless otherwise specified
- Source : INSEE
tableautabmatprem – Imported raw materials (excluding energy) in domestic currency
| Index | Changes (%) | |||
|---|---|---|---|---|
| over last month | over the last 3 months | over the last 12 months | ||
| Food total | 277,4 | –0,4 | 7,0 | 30,0 |
| Tropical beverages | 311,2 | 0,8 | 16,7 | 39,1 |
| Oil seeds, vegetable oils | 291,8 | –2,7 | –0,5 | 28,0 |
| Cereals | 279,4 | –3,6 | 1,0 | 27,9 |
| Sugar | 345,6 | –11,4 | –9,7 | 46,1 |
| Beef meat | 166,2 | 7,2 | 18,1 | 18,2 |
| Industrial raw materials | 279,3 | –0,4 | 6,3 | 23,5 |
| Agricultural raw materials | 173,4 | –0,7 | 3,8 | 15,2 |
| Natural Fibers | 429,2 | 7,0 | 34,3 | 147,3 |
| Natural rubber | 587,3 | –10,0 | 0,9 | 37,7 |
| Hides | 111,5 | –2,4 | –1,7 | 6,6 |
| Wood pulp | 142,1 | 1,6 | 3,4 | 9,7 |
| Tropical wood | 154,3 | 0,2 | 3,5 | 17,3 |
| Sawn softwood | 114,3 | 1,9 | 3,1 | 5,5 |
| Minerals | 335,8 | –0,3 | 7,1 | 26,7 |
| Iron ore | 637,0 | 0,0 | 0,8 | 81,7 |
| Non-ferrous metals | 297,2 | –1,4 | 7,7 | 18,5 |
| Precious metals | 431,4 | 7,5 | 15,1 | 51,2 |
| All commodities | 268,1 | –0,4 | 6,4 | 25,7 |
- Source : INSEE
graphiqueG_petrole_ang – Oil

graphiqueG_alim_ang – Food
- Source : INSEE
- Source : INSEE
graphiqueG_ensemble_ang – All commodities

- Source : INSEE
graphiqueG_indus_ang – Industrial raw materials
- Source : INSEE
Pour en savoir plus
Time series : Raw materials prices
