


 8 March 2011
2011In February 2011, prices of oil accelerated Prices of oil and raw material imports - February 2011
8 March 2011
2011In February 2011, prices of oil accelerated Prices of oil and raw material imports - February 2011
In February, price of oil in dollars accelerated (+7.4% after +5.1% in January), reaching $103.5 per barrel of Brent. Meanwhile, the foreign currency prices for non-energy com-modities imported in France continued to grow rapidly (+2.7% after +3.8% in January).

Warning : As every year in March, the weights have been updated for the current year, leading to a revision of the aggregate indexes for the month of January. Moreover, the sunflower oil was temporarily excluded from the price index of raw food materials imported, in the absence of data for the end of 2010.
In February, price of oil in dollars accelerated (+7.4% after +5.1% in January), reaching $103.5 per barrel of Brent. Meanwhile, the foreign currency prices for non-energy commodities imported in France continued to grow rapidly (+2.7% after +3.8% in January).
Acceleration in oil price
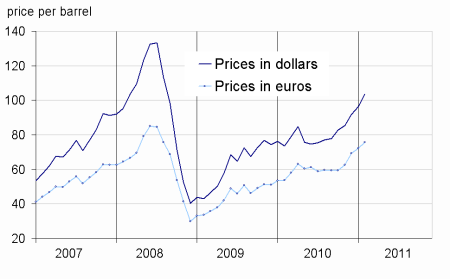
In February, prices in dollars of oil from the North Sea (Brent) accelerated (+7.4% after 5.1%). Indeed, the political tensions in the Middle East give fear tensions on supply while demand remains strong, and physical market keeps in deficit. In euros, the oil prices rose less strongly (+5.1% after 3.9%), due to the appreciation of European currency towards the dollar (+2.1).
Downturn in prices of imported industrial raw materials
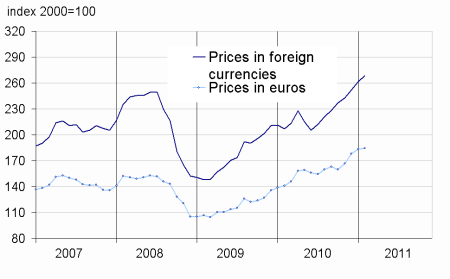
In February, prices of industrial raw materials in foreign currencies slowed (+2.3% after +3.9%). On the hand, prices of the mineral raw materials continued to grow rapidly (+3.4% after 3.5%). Among the nonferrous metals (+4.2%), the prices of titanium (+10.2%) and nickel (+10.1%) strongly increased. Meanwhile, prices of precious metals accelerated (+4.1% after +2.6%), especially silver (+7.9% after -3.2%) and gold (+1.1% after -2.5%).
On the other hand, prices of agro-industrial raw materials fell (-0.7% after +5.3%): the prices of sawn wood of conifers declined(-6.0%) and the prices of natural rubber clearly decreased (+0.4% after +11.6%), even though prices of natural fiber textiles strongly increased (+17.8%).
The prices of raw food materials imported kept on rising
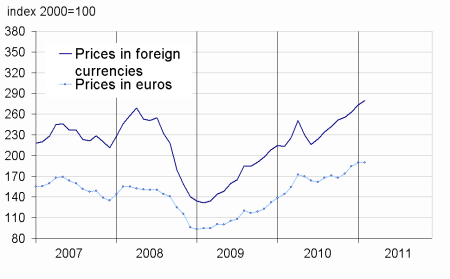
In February, prices of raw food in foreign currencies continued to rise (+3.3% after +3.9%), notably cereals (+4.1% after +0.4%) and tropical beverages (+9.2% after +5.7%), with the surge in cocoa prices (+11.2% after +4.1%) due to political tensions in Côte d’Ivoire. However, sugar prices fell (-1.1% after +3.0%), because of a better production than expected in Brazil and India.
tableautabpetrole – Oil and petroleum products
| Prices | Change (%) | |||
|---|---|---|---|---|
| of last month | over the last month | over the last 3 months | over the last 12 months | |
| Brent in $ per barrel | 103,5 | 7,4 | 21,4 | 40,6 |
| Brent in € per barrel | 75,8 | 5,1 | 21,3 | 40,9 |
| Gasoline | 877,1 | 4,7 | 14,0 | 27,9 |
| Gas Oil | 879,9 | 9,6 | 21,2 | 43,0 |
| Heavy fuel | 540,2 | 12,5 | 20,0 | 26,5 |
| Naphta | 876,8 | 2,9 | 12,4 | 29,4 |
- Prices are in dollars per tonne unless otherwise specified
- Source : INSEE
tableautabmatprem – Imported raw materials (excluding energy) in domestic currency
| Index | Changes (%) | |||
|---|---|---|---|---|
| of last month | over last month | over the last 3 months | over the last 12 months | |
| Food total | 278,3 | 3,3 | 13,1 | 28,1 |
| Tropical beverages | 307,7 | 9,2 | 22,2 | 32,1 |
| Oil seeds, vegetable oils | 300,3 | 0,0 | 8,7 | 32,4 |
| Cereals | 289,5 | 4,1 | 11,0 | 27,1 |
| Sugar | 389,5 | –1,1 | 9,8 | 19,3 |
| Beef meat | 154,9 | 1,6 | 12,2 | 19,4 |
| Industrial raw materials | 279,5 | 2,3 | 9,4 | 30,9 |
| Agricultural raw materials | 174,6 | –0,7 | 7,3 | 17,6 |
| Natural Fibers | 400,7 | 17,8 | 35,3 | 145,8 |
| Natural rubber | 652,3 | 0,4 | 23,6 | 57,1 |
| Hides | 114,3 | 0,8 | 0,3 | 17,1 |
| Wood pulp | 139,8 | 0,7 | 0,1 | 13,3 |
| Tropical wood | 154,0 | 2,2 | 4,5 | 18,5 |
| Sawn softwood | 112,2 | –6,0 | 5,1 | 0,6 |
| Minerals | 335,3 | 3,4 | 10,2 | 36,5 |
| Iron ore | 623,9 | 0,0 | –1,3 | 77,9 |
| Non-ferrous metals | 301,3 | 4,2 | 12,9 | 31,1 |
| Precious metals | 400,5 | 4,1 | 11,3 | 46,0 |
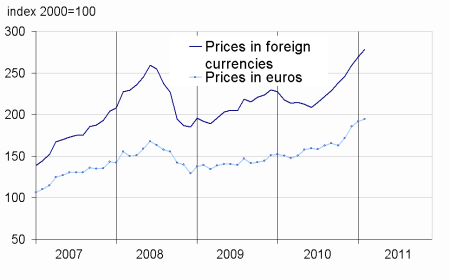
| All commodities | 268,5 | 2,7 | 10,7 | 29,6 |
- Source : INSEE
graphiqueG_petrole_ang – Oil
graphiqueG_alim_ang – Food
- Source : INSEE
- Source : INSEE
graphiqueG_ensemble_ang – All commodities
- Source : INSEE
graphiqueG_indus_ang – Industrial raw materials
- Source : INSEE
Pour en savoir plus
Time series : Raw materials prices
