


 4 April 2011
2011- n° 87In January 2011, the turnover grew in the retail trade and personal services Sales volume in the retail trade and personal services - January 2011
4 April 2011
2011- n° 87In January 2011, the turnover grew in the retail trade and personal services Sales volume in the retail trade and personal services - January 2011
In January 2011, the turnover rose in household services (+3.5%) and in the trade and repair of motor vehicles and motorcycles (+3.3%), notably due to the anticipation of the end of the scrappinf premium. It also grew in accomodation and food service activities (+2.3%) and in the retail trade, except of motor vehicles and motorcycles (+1.5%).

Every index in this issue is in volume, seasonally and working-day adjusted.
In January 2011, the turnover rose in household services (+3.5%) and in the trade and repair of motor vehicles and motorcycles (+3.3%), notably due to the anticipation of the end of the scrappinf premium. It also grew in accomodation and food service activities (+2.3%) and in the retail trade, except of motor vehicles and motorcycles (+1.5%).
graphiqueGraph1_Anglais – Retail trade and personal services
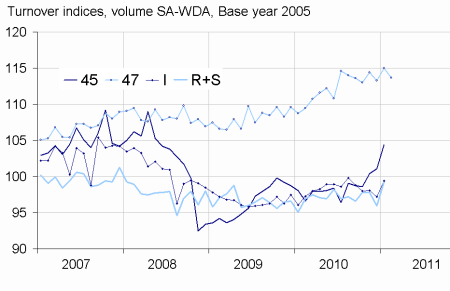
- Source : INSEE
Please note that the « retail trade… » chart (47) includes the early estimate for February 2011.
Quarter on quarter (q-o-q), the turnover increased in the trade and repair of motor vehicles and motorcycles (+3.2%), and, to a lesser extent, in the “retail trade…” (+0.6%) and in household services (+0.5%). On the contrary, it declined in accommodation and food service activities (–0.6%).
Year on year (y-o-y), the turnover grew in the “retail trade…” (+4.9%), in the trade and repair of motor vehicles and motorcycles (+3.3%), in accommodation and food services activities (+1.7%) and in households services (+1.7%).
According to our estimate, the turnover in the “retail trade…” is expected to decline in February 2011 (–1.2%).
From now on, turnover indices are seasonnally and working-day adjusted with X12-ARIMA and no longer with TRAMO-SEATS. Due to this change and to the update of all the SA-WDA models, revisions are higher than usual.
The SA-WDA evolution in December has been revised by –0.8 point in the “retail trade...”, by –0.5 point in accommodation and food service activities, by –0.5 point in household services and by +0.8 point in the trade and repair of motor vehicles and motorcycles.
tableauTableau 1 – Monthly turnover indices
| Change in % | |||||
|---|---|---|---|---|---|
| Classification NAF rev. 2 | Weight | Jan./ Dec. | Dec./ Nov. | q-o-q (1) | y-o-y (2) |
| 45 Trade and repair of motor vehicles and motorcycles | 1000 | 3.3 | 0.7 | 3.2 | 3.3 |
| 47 Retail trade, except of motor vehicles and motorcycles | 1000 | 1.5 | –1.0 | 0.6 | 4.9 |
| 471 Retail sale in non-specialised stores | 415 | 0.6 | –0.3 | 1.6 | 3.6 |
| 472 to 477 Retail sale in specialised stores | 545 | 2.3 | –1.6 | –0.1 | 5.9 |
| 478 and 479 Retail trade not in stores | 40 | –0.6 | 2.0 | 2.2 | 3.3 |
| I Accommodation and food service activities | 1000 | 2.3 | –0.9 | –0.6 | 1.7 |
| R+S Households services | 1000 | 3.5 | –1.9 | 0.5 | 1.7 |
| R Arts, entertainment and recreation | 472 | 3.2 | –0.7 | 0.6 | 2.6 |
| S Other service activities | 528 | 3.9 | –3.0 | 0.2 | 0.8 |
- (1) Quarter-on-quarter: last three months / three previous months.
- (2) Year-on-year: last three months / three same months of the previous year.
- The codes correspond to differents levels of aggregation of the classification NAF rev.2.
- Source: INSEE
tableauTableau 2 – Turnover indices: early estimate*
| Change in % | ||
|---|---|---|
| Feb. 2011/Jan. 2011 | Feb. 2011/Feb. 2010 | |
| 47 Retail trade… | –1.2 | 3.7 |
- * Econometric estimate from a set of sources available within 30 days after the end of the reference month
- Source: INSEE
Documentation
Methodology (pdf,121 Ko)
Pour en savoir plus
