


 18 January 2011
2011- n° 14A decrease in enterprise births in December 2010 Enterprise births - december 2010
18 January 2011
2011- n° 14A decrease in enterprise births in December 2010 Enterprise births - december 2010
In December 2010, the number of enterprise births decreased compared to November (-6.7%).
Warning : From the August issue, only enterprise births data excluding self-managed enterprises (SME) are seasonally adjusted. In order to get the total of enterprise births, the raw number of SME is added. The SME time series is too short to be properly deseasonalized.
In December 2010, the number of enterprise births decreased compared to November (-6.7%).
-4.1% year-on-year (quarterly basis)
The amount of entries, added up October, November and December 2010, decreased by 4.1% compared to the same quarter one year before.
The sectors that most contributed to that increase were wholesale and retail trade and household services.
+7.2% year-on-year (twelve months basis)
During the last twelve months, the number of births climbed by 7.2% year-on-year.
359,699 self-managed enterprises in 2010
In 2010, more than one out of two births enterprises were self-managed enterprises (359,699).
tableautab0EN – Self-managed entreprise births
| Sept. 2010 | Oct. 2010 | Nov. 2010 | Dec. 2010 |
|---|---|---|---|
| 30 954 | 32 963 | 28 808 | 22 243 |
- Source: INSEE (Sirene)
tableautab1EN – Enterprise births by month
| Sept. 2010 | Oct. 2010 | Nov. 2010 | Dec. 2010 | |
|---|---|---|---|---|
| Excl. self-managed enterprises (sa-wda *) | 26 512 | 19 332 | 23 230 | 26 289 |
| Variation [m-o-m] % | 16.5 | -27.1 | 20.2 | 13.2 |
| Incl. self-managed enterprises (in raw data) | 57 466 | 52 295 | 52 038 | 48 532 |
| Variation [m-o-m] % | 30.9 | -9.0 | -0.5 | -6.7 |
- * Seasonally and working-day adjusted data
- Source: INSEE (Sirene)
tableautab2EN – Enterprise births by type
| Moving total % change* | Moving total | Moving total | ||
|---|---|---|---|---|
| over 3 months | over 12 months | January- December 2010 | January- December 2009 | |
| Total | -4.1 | 7.2 | 622 039 | 580 193 |
| Companies | -0.2 | 7.5 | 163 659 | 152 303 |
| Individual enterprises | -5.5 | 7.1 | 458 380 | 427 890 |
| Of which self-managed | -6.3 | 12.4 | 359 699 | 320 019 |
- * Total of enterprises births during the last 3 or 12 months compared with the same months a year earlier
- // = meaningless
- Source: INSEE (Sirene)
graphiqueGraph1EN – Enterprise births
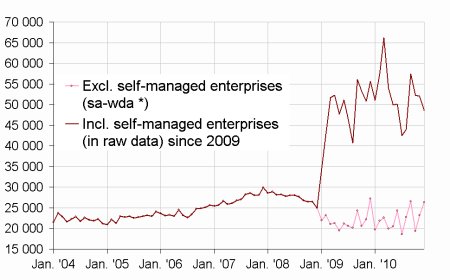
- * Seasonally and working-day adjusted data
- Source: INSEE (Sirene)
Pour en savoir plus
Time series : Business demography
