


 15 February 2011
2011- n° 40French GDP increased in Q4 (+0.3%) and +1.5% over the year Quarterly national accounts - second estimate - 4th Quarter 2010
15 February 2011
2011- n° 40French GDP increased in Q4 (+0.3%) and +1.5% over the year Quarterly national accounts - second estimate - 4th Quarter 2010
French GDP increased by 0.3% in the fourth quarter of 2010, after +0.3% in the previous quarter.
French GDP increased by 0.3% in the fourth quarter of 2010, after +0.3% in the previous quarter.
Over the year, GDP grew by 1.5%, after the sharpest decrease since World War II (-2.5% in 2009).
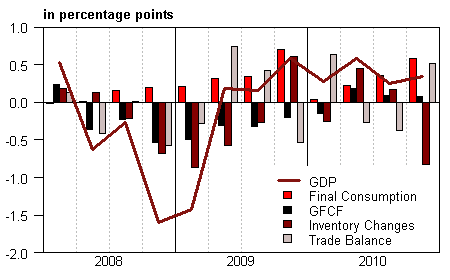
Households’ consumption expenditure accelerated (+0.9% after +0.5%). Gross fixed capital formation (GFCF) increased by +0.4% after +0.5%. Overall, total domestic demand (excluding inventory changes) drove GDP on for 0.7 point of growth after 0.4 in Q3. Exports slowed down (+0.8% after +2.6%) while imports fell (-1.2% after +3.9%). Consequently, foreign trade balance improved and contributed positively to GDP growth (+0.5 point after -0.4 point) This is overcompensated by changes in inventories, contributing for -0.8 point to GDP growth after +0.2 point.
Production’s growth leveled off
In Q4, production in goods and services grew at the same pace as in Q3: +0.3%. Production dropped in transportation and energy, notably due to strikes in October. These drops are compensated by production in manufactured goods which renewed with growth (+0.4% after -0.4%) Over the year, total production grew by 1.9% after -3.7% in 2009.
Households’ consumption accelerated
In Q4, households’ consumption expenditure increased by 0.9% (after +0.5%). It has been driven by a boom in energy consumption due to a cold December (+2.6% after -3.1%). It has also been supported by car purchases, rocketing before the end of the scrappage program in January 1st 2011 (+8.8% after +0.9%). Over the year, households’ consumption expenditure grew by 1.6% in 2010 after +0.6%.
* This growth rate is seasonally and trading-day adjusted; volumes are chain-linked previous-year-prices volumes.
graphiqueGraph1 – GDP and its main components
tableauTableau 1 – GOODS AND SERVICES: RESOURCES AND USES CHAIN-LINKED VOLUMES
| 2010 Q1 | 2010 Q2 | 2010 Q3 | 2010 Q4 | 2009 | 2010 | |
|---|---|---|---|---|---|---|
| GDP | 0.3 | 0.6 | 0.3 | 0.3 | -2.5 | 1.5 |
| Imports | 1.9 | 3.7 | 3.9 | -1.2 | -10.6 | 7.7 |
| Households' consumption expenditure | 0.1 | 0.3 | 0.5 | 0.9 | 0.6 | 1.6 |
| General government's consumption expenditure | 0.0 | 0.2 | 0.3 | 0.3 | 2.8 | 1.4 |
| GFCF | -0.7 | 0.9 | 0.5 | 0.4 | -7.0 | -1.6 |
| of which Non financial corporated and unincorporated enterprises | -0.7 | 1.3 | 0.4 | 0.6 | -7.9 | -1.4 |
| Households | -0.5 | 0.1 | 1.1 | 0.6 | -8.7 | -2.2 |
| General government | -1.5 | 1.0 | -0.4 | -0.7 | 0.6 | -1.0 |
| Exports | 4.8 | 2.8 | 2.6 | 0.8 | -12.2 | 9.9 |
| Contributions : | ||||||
| Internal demand excluding inventory changes | -0.1 | 0.4 | 0.4 | 0.7 | -0.5 | 1.0 |
| Inventory changes | -0.3 | 0.4 | 0.2 | -0.8 | -1.8 | 0.1 |
| Net foreign trade | 0.6 | -0.3 | -0.4 | 0.5 | -0.2 | 0.4 |
tableauTableau 3 – Sectoral accounts
| 2010 Q1 | 2010 Q2 | 2010 Q3 | 2010 Q4 | 2009 | 2010 (ovhg) | |
|---|---|---|---|---|---|---|
| Profit ratio of NFC* (level) | 29.8 | 29.5 | 29.7 | 29.8 | 0.0 | |
| Household purchasing power | 0.1 | 0.5 | 0.7 | 1.6 | 1.4 |
- *NFC : non-financial corporations
tableauTableau 4 – Household disposable income and household account ratios
| 2010 Q1 | 2010 Q2 | 2010 Q3 | 2010 Q4 | 2009 | 2010 (ovhg) | |
|---|---|---|---|---|---|---|
| HDI | 0.6 | 0.8 | 0.8 | 1.1 | 2.4 | |
| Household purchasing power | 0.1 | 0.5 | 0.7 | 1.6 | 1.4 | |
| HDI by ci* (purchasing power) | -0.1 | 0.3 | 0.5 | 0.8 | 0.6 | |
| Adjusted HDI (purchasing power) | 0.1 | 0.5 | 0.6 | 1.6 | 1.4 | |
| Saving rate (level) | 15.9 | 16.1 | 16.3 | 16.2 | 0.0 | |
| Financial saving rate (level) | 7.0 | 7.2 | 7.3 | 7.0 | 0.0 |
- * ci : consumption unit
Investment steadily increased
Total GFCF increased again in Q4 (+0.4% after +0.5%). The drop in public administrations’ investment (-0.7% after -0.4%) is mainly imputable to the drop in civil engineering, due to weather conditions. Households’ GFCF slowed down (+0.6% after +1.1%), but GFCF by non financial corporations slightly accelerated (+0.6% after +0.4%), in particular in business services. Over the year, total GFCF, which bottomed out at the beginning of the year, fell by 1.6% after -7.0%.
Foreign trade balance improved
Exports slowed down (+0.8% after +2.6%) as a result of the slow down in manufactured goods (+1.5% after +3.5%) and the drop in energy exports (-16.9% after +3.1%).
Meanwhile, imports fell (-1.2% after +3.9%), in particular in equipment and intermediate goods, only imports in cars markedly accelerated. Consequently, foreign trade balance improved and contributed positively to GDP growth (+0.5 point after -0.4 point) Over the year exports increased by 9.9% (after -12.1% in 2009) while imports increased by 7.7% (after -10.6%). In 2010, foreign trade balance accounted for 0.4 point of GDP growth (after -0.2 point in 2009).
Changes in inventories weighted GDP down
In Q4, changes in inventories accounted for -0.8 point of GDP growth. These negative contribution in mainly imputable to equipment goods, in particular aeronautic, and intermediate goods. Over the year, changes in inventories contributed for 0.1 point to GDP growth while they drastically weighted on the previous year’s recession (-1.8 point).
Revisions
GDP growth in 2010Q3 is still estimated at +0.3%. Revisions with respect to the previous publication are small. They are mainly due to the update of seasonal and working day adjustment.
Pour en savoir plus
Time series : Operations on goods and services
Time series : Gross domestic product balance
Time series : Institutional sector accounts
Time series : Branch accounts
