


 16 June 2011
2011- n° 149An increase in enterprise births in May 2011 Enterprise births - May 2011
16 June 2011
2011- n° 149An increase in enterprise births in May 2011 Enterprise births - May 2011
In May 2011, the number of enterprise births increased compared to April: +29% for enterprise births excluding self-managed enterprises (seasonally and working-day adjusted data); +15.1% when the number of self-managed enterprises (raw data) is added.
Warning : From the August issue, only enterprise births data excluding self-managed enterprises (SME) are seasonally adjusted. In order to get the total of enterprise births, the raw number of SME is added. The SME time series is too short to be properly deseasonalized.
In May 2011, the number of enterprise births increased compared to April: +29% for enterprise births excluding self-managed enterprises (seasonally and working-day adjusted data); +15.1% when the number of self-managed enterprises (raw data) is added.
-14.9% year-on-year (quarterly basis)
The amount of entries, added up March, April and May 2011, decreased by 14.9% compared to the same quarter one year before.
The sectors that most contributed to that decrease were service activities and wholesale and retail trade.
-8.2% year-on-year (twelve months basis)
During the last twelve months, the number of births decreased by 8.2% year-on-year.
127,217 self-managed enterprises since the beginning of 2011
From January to May 2011, one out of every two births enterprises were self-managed enterprises (127,217).
tableautab0EN – Self-managed entreprise births
| Feb. 2011 | March 2011 | April 2011 | May 2011 |
|---|---|---|---|
| 25 010 | 28 610 | 24 430 | 25 542 |
- Source: INSEE (Sirene)
tableautab1EN – Enterprise births by month
| Feb. 2011 | March 2011 | April 2011 | May 2011 | |
|---|---|---|---|---|
| Excl. self-managed enterprises (sa-wda *) | 22 391 | 23 871 | 18 416 | 23 759 |
| Variation [m-o-m] % | 14.0 | 6.6 | -22.9 | 29.0 |
| Incl. self-managed enterprises (in raw data) | 47 401 | 52 481 | 42 846 | 49 301 |
| Variation [m-o-m] % | 9.6 | 10.7 | -18.4 | 15.1 |
- * Seasonally and working-day adjusted data
- Source: INSEE (Sirene)
tableautab2EN – Enterprise births by type
| Moving total % change* | Moving total | Moving total | ||
|---|---|---|---|---|
| over 3 months | over 12 months | January- May 2011 | January- May 2010 | |
| Total | -14.9 | -8.2 | 244 442 | 288 230 |
| Companies | 6.8 | 5.5 | 74 419 | 70 685 |
| Individual enterprises | -21.8 | -12.8 | 170 023 | 217 545 |
| Of which self-managed | -26.5 | -15.7 | 127 217 | 173 742 |
- * Total of enterprises births during the last 3 or 12 months compared with the same months a year earlier
- // = meaningless
- Source: INSEE (Sirene)
graphiqueGraph1EN – Enterprise births
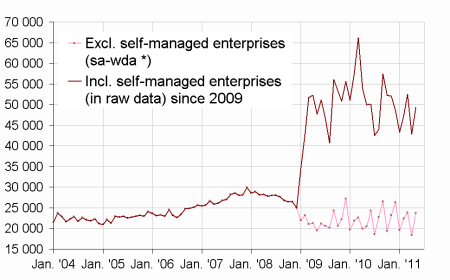
- * Seasonally and working-day adjusted data
- Source: INSEE (Sirene)
Pour en savoir plus
Time series : Business demography
