


 10 June 2011
2011In May 2011, the prices of the imported commodities declined Prices of oil and raw material imports - May 2011
10 June 2011
2011In May 2011, the prices of the imported commodities declined Prices of oil and raw material imports - May 2011
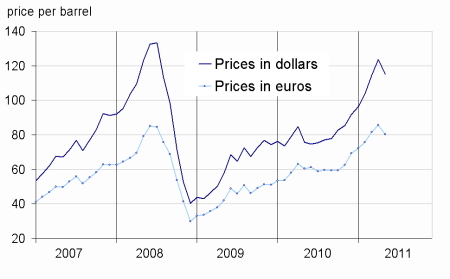
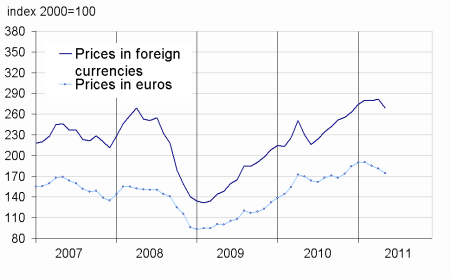
In May, the price of oil in dollars fell (-6.9% after +7.9% in April) to $115.1 per barrel of Brent. The foreign currency prices for non-energy commodities imported in France also fell (-3.8% after +0.3% in April).
In May, the price of oil in dollars fell (-6.9% after +7.9% in April) to $115.1 per barrel of Brent. The foreign currency prices for non-energy commodities imported in France also fell (-3.8% after +0.3% in April).
The price of oil decreased
In May, the prices in dollars of oil from the North Sea (Brent) declined (-6.9% after +7.9%). In euros, the decline in oil prices has been slightly lower (-6.1%) due to the depreciation of the euro against the dollar (-0.8%). The continuing rise in oil price since mid-2010 (+65.4% in dollars between June 2010 and April 2011) was then interrupted.
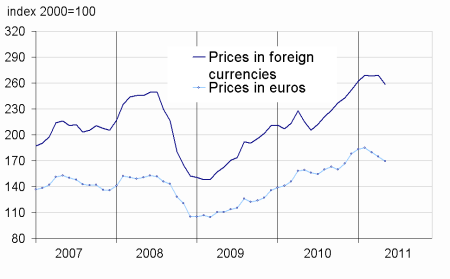
The prices of industrial raw materials folded
In May, the prices of industrial raw materials in foreign currencies fell (-4.5% after +0.9%). The prices of mineral raw materials also fell (-4.0% after +1.7%). The prices of precious metals have been returned (-5.5% after +9.4%), in particular the price of silver (-12.4% after +17.2%). The prices of nonferrous metals have also folded (-4.8% after +1.7%) for copper and aluminium, which accounted for +24.8% of non-energy commodities imported in France in 2010, they fell respectively by 5.9% and 2.7%.
Meanwhile, the falling of the prices of agro-industrial raw materials increased (-6.0% after -1.5%). The prices of sawn timber of conifers highly folded (-13.5%) and those of natural rubber (-9.2%) and natural textiles fibers (-19.8%). In particular, cotton prices fell sharply (-22.6%) because of bumper crops in the Southern Hemisphere (Brazil and Australia).
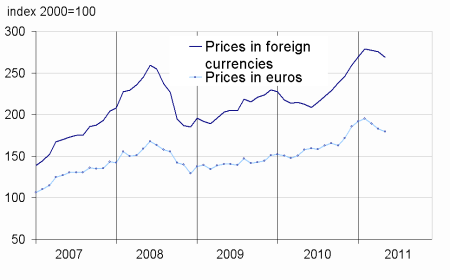
Lower prices of raw food materials continued
In May, the prices of raw food in foreign currencies declined again (-2.5% after –0.7%). Sugar prices continued to fall sharply (-14.1% after –9.7% in April already) because of improved prospects for crops in major producing countries. Prices of beef meat also fell (-5.9%) and those of cereals decreased slightly (-0.5%), mainly corn (-4.3%).
tableautabpetrole – Oil and petroleum products
| Prices | Change (%) | |||
|---|---|---|---|---|
| of last month | over the last month | over the last 3 months | over the last 12 months | |
| Brent in $ per barrel | 115,1 | –6,9 | 11,2 | 52,0 |
| Brent in € per barrel | 80,3 | –6,1 | 5,9 | 33,0 |
| Gasoline | 1072,1 | –5,9 | 22,2 | 48,3 |
| Gas Oil | 937,5 | –8,3 | 6,5 | 43,6 |
| Heavy fuel | 603,6 | –4,4 | 11,7 | 43,7 |
| Naphta | 1038,6 | –1,3 | 18,5 | 52,2 |
- Prices are in dollars per tonne unless otherwise specified
- Source : INSEE
tableautabmatprem – Imported raw materials (excluding energy) in domestic currency
| Index | Changes (%) | |||
|---|---|---|---|---|
| over last month | over the last 3 months | over the last 12 months | ||
| Food total | 268,5 | –2,5 | –3,6 | 26,4 |
| Tropical beverages | 298,4 | –1,2 | –3,4 | 29,5 |
| Oil seeds, vegetable oils | 290,7 | –0,9 | –3,1 | 30,8 |
| Cereals | 284,5 | –0,5 | –1,8 | 39,7 |
| Sugar | 268,3 | –14,1 | –31,2 | 49,6 |
| Beef meat | 158,4 | –5,9 | 2,2 | 4,9 |
| Industrial raw materials | 269,1 | –4,5 | –4,1 | 17,0 |
| Agricultural raw materials | 160,6 | –6,0 | –8,1 | 5,5 |
| Natural Fibers | 323,4 | –19,8 | –19,3 | 82,5 |
| Natural rubber | 548,4 | –9,2 | –15,9 | 45,1 |
| Hides | 105,1 | –4,6 | –8,1 | –8,8 |
| Wood pulp | 147,2 | 0,7 | 5,2 | 5,6 |
| Tropical wood | 158,6 | 1,5 | 3,0 | 14,3 |
| Sawn softwood | 88,3 | –13,5 | –21,3 | –16,6 |
| Minerals | 327,8 | –4,0 | –2,7 | 21,4 |
| Iron ore | 622,6 | 0,0 | –2,3 | 1,6 |
| Non-ferrous metals | 287,6 | –4,8 | –4,6 | 23,3 |
| Precious metals | 446,0 | –5,5 | 11,1 | 47,0 |
| All commodities | 258,6 | –3,8 | –3,9 | 20,3 |
- Source : INSEE
graphiqueG_petrole_ang – Oil
graphiqueG_alim_ang – Food
- Source : INSEE
- Source : INSEE
graphiqueG_ensemble_ang – All commodities
- Source : INSEE
graphiqueG_indus_ang – Industrial raw materials
- Source : INSEE
Pour en savoir plus
Time series : Raw materials prices
