


 22 April 2011
2011- n° 100In Q1 2011, Demand adressed to business leaders still considered dynamic Quarterly business survey (goods-producing industries) - April 2011
22 April 2011
2011- n° 100In Q1 2011, Demand adressed to business leaders still considered dynamic Quarterly business survey (goods-producing industries) - April 2011
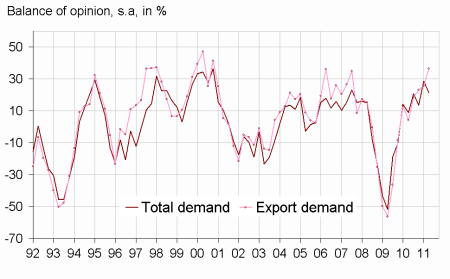
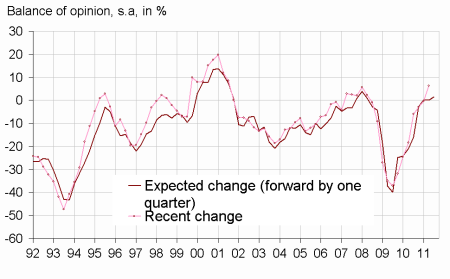
In Q1 2011, global demand as export demand adressed to business leaders remained dynamic: the corresponding balance, although edging down, stays above its long-term average. The global demand outlook remains stable, while export demand outlook declines slightly. They both remain however above their long-term average.
Manufacturing industry
In Q1 2011, global demand as export demand adressed to business leaders remained dynamic: the corresponding balance, although edging down, stays above its long-term average. The global demand outlook remains stable, while export demand outlook declines slightly. They both remain however above their long-term average.
Production capacity was used in Q1 2011 as the same rate in Q4 2010: the proportion of businesses encountering production bottlenecks stabilizes above its long-term average.
According to the business leaders the industrial manpower has continued to increase in Q1 2011 : the corresponding balance stands at its highest level for three years. The industrial manpower could increase again in Q2 2011.
tableautableau – Business leaders' opinion : Demand and production factors
| Manufacturing industry | MOY* | Jul. 10 | Oct. 10 | Jan. 11 | Apr. 11 |
|---|---|---|---|---|---|
| Total demand | |||||
| Recent changes | 1 | 21 | 14 | 29 | 21 |
| Expected change | 1 | –2 | 10 | 7 | 7 |
| Export demand | |||||
| Recent changes | 3 | 19 | 23 | 26 | 36 |
| Expected change | 5 | 3 | 17 | 23 | 16 |
| Production factors | |||||
| Share of firms producing at full capacity (in%) | 22 | 22 | 29 | 28 | 28 |
| Opinion on production capacity | 14 | 15 | 21 | 17 | 7 |
| Productive capacity utilization rate (in %) | 85 | 77 | 79 | 80 | 81 |
| Difficulties of supply and demand | |||||
| Difficulties of supply and demand | 6 | 9 | 10 | 8 | 9 |
| Difficulties of supply | 20 | 22 | 17 | 22 | 25 |
| Difficulties of demand | 43 | 45 | 47 | 33 | 29 |
- * : Long period average.
- Source : Quarterly business survey - INSEE
graphiqueGraph1ang – Recent changes in demand
graphiqueGraph3ang – Workforce in manufacturing industry
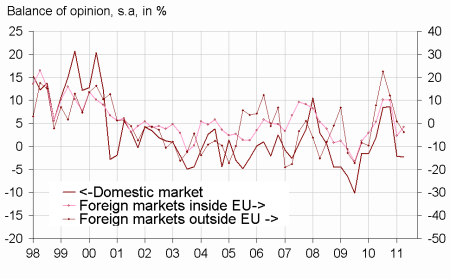
graphiqueGraph4ang – Competitive position
Documentation
Methodology (pdf,48 Ko)
Pour en savoir plus
Time series : Industry
