


 11 January 2011
2011- n° 102274n°246 In December 2010, The prices of the imported commodities have accelerated Prices of oil and raw material imports - December 2010
11 January 2011
2011- n° 102274n°246 In December 2010, The prices of the imported commodities have accelerated Prices of oil and raw material imports - December 2010
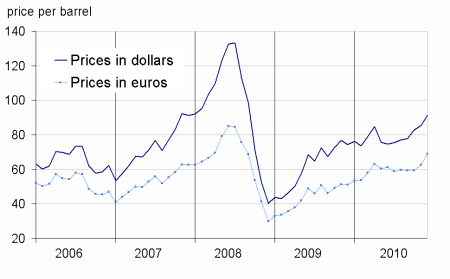
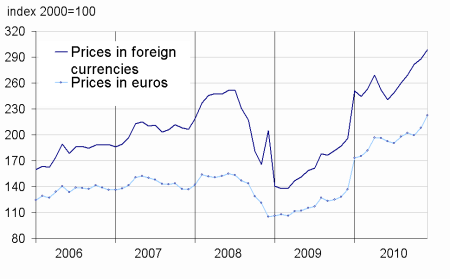
In December, the price of oil in dollars accelerated (+7.1% after +3.1% in November), reaching $91.3 per barrel of Brent. It was the same for the foreign currency prices for non-energy commodities imported in France (+3.7% after +2.3% in November).
In December, the price of oil in dollars accelerated (+7.1% after +3.1% in November), reaching $91.3 per barrel of Brent. It was the same for the foreign currency prices for non-energy commodities imported in France (+3.7% after +2.3% in November).
The price of oil accelerated
In December, the prices in dollars of oil from the North Sea (Brent) accelerated (+7.1% after 3.1%). The increase in demand, with the harsh winter in the northern hemisphere, supported the increase in the price of oil. In euros, the rise in oil prices was even higher (+10.5%), due to the depreciation of the euro vis-à-vis the dollar (-3.1 %).
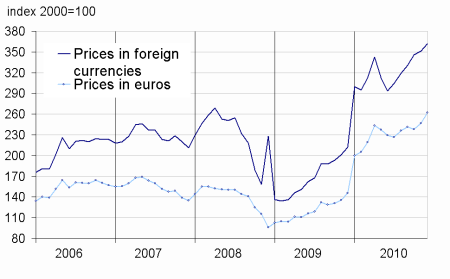
The Prices of industrial raw materials continued to rise
In December, the prices of industrial raw materials in foreign currencies have again increased (+2.9% after +1.7%). The prices of the mineral raw materials rose again (+2.7%) after stagnating in November, reflecting the rebound in the prices of nonferrous metals (+3.0% after -0.2%), in particularly cooper (+7.9%) and nickel (+5.2%). In contrast, the prices of precious metals have somewhat slowed (+4.2% after +4.9%), including palladium (+10.9% after +14.4%) and silver (+10.7% after +13.3%).
The increase in the prices of agro-industrial raw materials was moderated in December after a sharp rise in November (+3.6% after +6.5%). The prices of natural textile fibers slowed (+7.7% after 21.0%), notably cotton (+8.3% after +23.1%) as well as the courses of sawn wood of conifers (+3.9% after 11.8%).
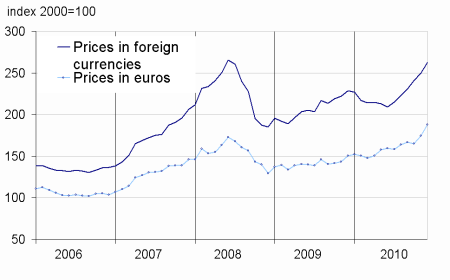
The increase of the prices of raw food materials imported reinforced
In December, the prices of raw food in foreign currencies have accelerated (+5.2% after +3.6%), in particularly cereals (+6.0% after +2.0%) and beef meat (+2.0% after +0.6%). The prices of tropical beverages have also accelerated (+5.9% after +2.4%), due to the rebound in prices of tea and cocoa. Finally, the prices of oilseeds, vegetable oils and sugar grew at the same pace as in December.
tableautabpetrole – Oil and petroleum products
| Prices | Change (%) | |||
|---|---|---|---|---|
| of last month | over the last month | over the last 3 months | over the last 12 months | |
| Brent in $ per barrel | 91,3 | 7,1 | 17,4 | 22,6 |
| Brent in € per barrel | 69,1 | 10,5 | 16,3 | 35,2 |
| Gasoline | 828,6 | 7,7 | 17,3 | 24,7 |
| Gas Oil | 759,4 | 4,6 | 12,9 | 24,7 |
| Heavy fuel | 458,8 | 1,9 | 9,6 | 8,3 |
| Naphta | 840,4 | 7,7 | 24,4 | 23,3 |
- Prices are in dollars per tonne unless otherwise specified
- Source : INSEE
tableautabmatprem – Imported raw materials (excluding energy) in domestic currency
| Index | Changes (%) | |||
|---|---|---|---|---|
| over last month | over the last 3 months | over the last 12 months | ||
| Food total | 262,6 | 5,2 | 13,9 | 14,8 |
| Tropical beverages | 266,7 | 5,9 | 11,3 | 2,5 |
| Oil seeds, vegetable oils | 298,4 | 5,5 | 18,6 | 25,0 |
| Cereals | 276,8 | 6,0 | 17,2 | 14,4 |
| Sugar | 382,7 | 7,6 | 31,4 | 25,2 |
| Beef meat | 140,8 | 2,0 | 1,0 | 16,8 |
| Industrial raw materials | 361,7 | 2,9 | 9,5 | 70,8 |
| Agricultural raw materials | 173,3 | 3,6 | 15,8 | 32,4 |
| Natural Fibers | 319,7 | 7,7 | 56,1 | 104,0 |
| Natural rubber | 581,9 | 10,3 | 37,0 | 52,9 |
| Hides | 113,4 | –0,5 | 2,1 | 20,0 |
| Wood pulp | 137,4 | –1,6 | –3,0 | 17,5 |
| Tropical wood | 149,0 | 1,2 | 2,4 | 12,6 |
| Sawn softwood | 110,9 | 3,9 | 23,1 | 29,6 |
| Minerals | 442,4 | 2,7 | 7,4 | 72,1 |
| Iron ore | 632,2 | 0,0 | –11,2 | 80,3 |
| Non-ferrous metals | 439,3 | 3,0 | 10,3 | 65,2 |
| Precious metals | 384,3 | 4,2 | 17,6 | 33,8 |
| All commodities | 298,6 | 3,7 | 11,0 | 52,6 |
- Source : INSEE
graphiqueG_petrole_ang – Oil
graphiqueG_alim_ang – Food
- Source : INSEE
- Source : INSEE
graphiqueG_ensemble_ang – All commodities
- Source : INSEE
graphiqueG_indus_ang – Industrial raw materials
- Source : INSEE
Pour en savoir plus
Time series : Raw materials prices
