


 7 December 2010
2010- n° 3002274n°246 The prices of the imported commodities slowed in November Prices of oil and raw material imports - November 2010
7 December 2010
2010- n° 3002274n°246 The prices of the imported commodities slowed in November Prices of oil and raw material imports - November 2010
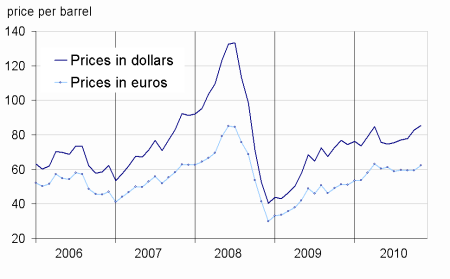
In November, the price of oil in dollars slowed (+3.1% after 6.3% in October), reaching $ 85.2 per barrel of Brent.
In November, the price of oil in dollars slowed (+3.1% after 6.3% in October), reaching $ 85.2 per barrel of Brent.
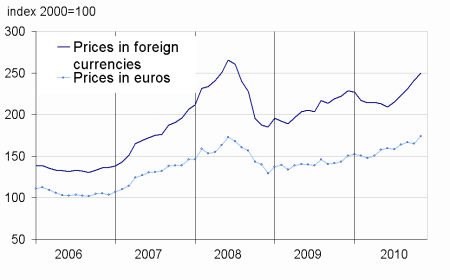
The prices for non-energy commodities imported by France have also slowed (+2.3% in foreign currencies, after +5.5% in October).
The price of oil slowed
In November, the dollar price of oil from the North Sea (Brent) was slower than in October (+3.1% after 6.3%). In euros, however, the prices of oil rose more sharply (+4.9%), due to the depreciation of the euro vis-à-vis the dollar (-1.7 %).
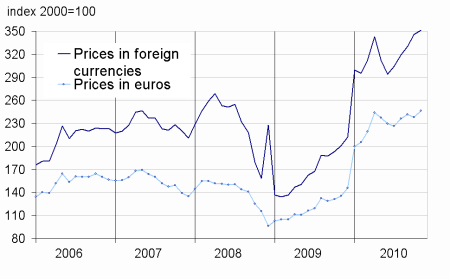
The Prices of industrial raw materials slowed
In November, the prices of industrial raw materials in foreign currencies have significantly slowed (+1.7% after +5.9%). Among the mineral raw materials (+0.1% after +6.2%), the prices of nonferrous metals have actually declined (-0.2% after +7.4%), including god (+2.0% after +5.6%) and platinum (+0.3% after 6.1%). In contrast, the price of palladium accelerated sharply (+14.4% after 9.7%), due to the combined effect of strikes in some mines of South Africa and increasing in demand from China’s auto industry.
Meanwhile, the prices of agro-industrial raw materials continued to rise +6.5% after 5.0%), as a result of higher natural textile fibers (+2.1% after 19.8%), including cotton (+23.11%), and the rebound in prices of sawn wood of conifers (+11.8% after 6.1%).
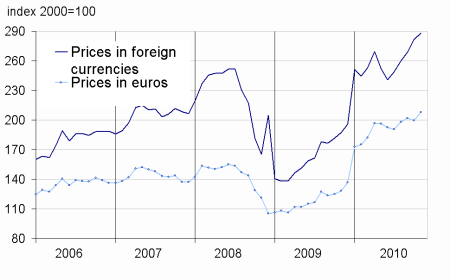
The prices of raw food materials moderated
In November, the prices of raw food in foreign currencies have been lower than in October (+3.6% after +4.5%). The prices of cereals have sharply slowed (+2.0% after +8.4%), particularly corn (+1.4% after +13.0%). The prices of sugar also slowed (+7.5% after 13.6%). The slowdown was less marked for oilseeds (+5.6% after +6.5%) and tropical beverages (+2.4% after +2.7%), despite the falling prices of tea (-6.7%) and cocoa (-1.1%).
tableautabpetrole – Oil and petroleum products
| Prices | Change (%) | |||
|---|---|---|---|---|
| of last month | over the last month | over the last 3 months | over the last 12 months | |
| Brent in $ per barrel | 85,2 | 3,1 | 10,7 | 11,2 |
| Brent in € per barrel | 62,4 | 4,9 | 4,5 | 21,3 |
| Gasoline | 768,3 | 0,5 | 9,8 | 10,3 |
| Gas Oil | 726,8 | 1,8 | 11,6 | 16,5 |
| Heavy fuel | 450,7 | 1,5 | 6,3 | –1,1 |
| Naphta | 779,7 | 4,0 | 18,2 | 16,7 |
- Prices are in dollars per tonne unless otherwise specified
- Source : INSEE
tableautabmatprem – Imported raw materials (excluding energy) in domestic currency
| Index | Changes (%) | |||
|---|---|---|---|---|
| over last month | over the last 3 months | over the last 12 months | ||
| Food total | 249,7 | 3,6 | 11,9 | 12,4 |
| Tropical beverages | 251,9 | 2,4 | 3,6 | 0,7 |
| Oil seeds, vegetable oils | 282,8 | 5,6 | 16,4 | 21,0 |
| Cereals | 261,2 | 2,0 | 22,2 | 15,3 |
| Sugar | 355,6 | 7,5 | 50,7 | 27,2 |
| Beef meat | 138,1 | 0,6 | 0,0 | 12,4 |
| Industrial raw materials | 351,5 | 1,7 | 10,1 | 74,8 |
| Agricultural raw mate rials | 167,3 | 6,5 | 16,0 | 34,4 |
| Natural Fibers | 296,9 | 21,0 | 65,8 | 100,2 |
| Natural rubber | 527,6 | 11,1 | 34,4 | 57,2 |
| Hides | 113,9 | 0,5 | –0,4 | 22,9 |
| Wood pulp | 139,6 | –1,2 | –1,1 | 22,6 |
| Tropical wood | 147,3 | 0,7 | –0,6 | 7,7 |
| Sawn softwood | 106,7 | 11,8 | 25,0 | 30,8 |
| Minerals | 431,0 | 0,1 | 8,2 | 76,6 |
| Iron ore | 632,2 | 0,0 | –11,2 | 80,3 |
| Non-ferrous metals | 426,5 | –0,2 | 11,3 | 70,6 |
| Precious metals | 368,9 | 4,9 | 19,7 | 30,2 |
| All commodities | 288,0 | 2,3 | 10,7 | 53,8 |
- Source : INSEE
graphiqueG_petrole_ang – Oil
graphiqueG_alim_ang – Food
- Source : INSEE
- Source : INSEE
graphiqueG_ensemble_ang – All commodities
- Source : INSEE
graphiqueG_indus_ang – Industrial raw materials
- Source : INSEE
Pour en savoir plus
Time series : Raw materials prices
