


 2 February 2011
2011- n° 32The turnover in manufacturing industry increased by 2.8% in November 2010 Turnover in industry and construction - November 2010
2 February 2011
2011- n° 32The turnover in manufacturing industry increased by 2.8% in November 2010 Turnover in industry and construction - November 2010
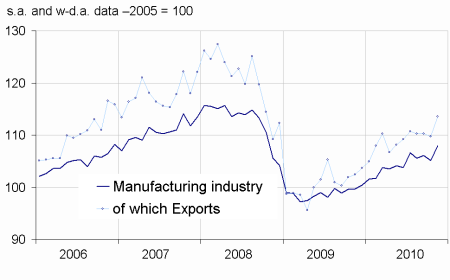
In November 2010, the turnover in manufacturing in-dustry rose by 2.8%, after a decline in October (–0.9%). Exports grew by +3.6%, after a decrease in October (–0.5%).

Every indices in this issue are in value, seasonally and working-day adjusted.
In November 2010, the turnover in manufacturing industry rose by 2.8%, after a decline in October (–0.9%). Exports grew by +3.6%, after a decrease in October (–0.5%).
The turnover bounced in the manufacture of transport equipment (+13.9%) ; it was down over the past three months. It also soared in the manufacture of coke and refined petroleum products (+13.9%), after having dropped in October (–12.6%).
In November, the turnover was up in the other manufacturing (+0.9%) and in the manufacture of food products and beverages (+1.7%). It declined in the electrical and electronic equipment ; machine equipment (–0.6%).
The turnover of the industry as a whole (B to E) grew in November by +2.8%.
graphiqueIRgraph3 – Turnover in manufacturing industry
- Source: Insee
On a quarterly basis (Q/Q–1), the turnover in manufacturing industry rose by 1.0%. It primarily went up in the other manufacturing (+1.0%), in the manufacture of food products and beverages (+2.5%) and in the electrical and electronic equipment ; machine equipment (+2.3%). On the contrary, it went down in the manufacture of coke and refined petroleum products (–1.3%) and in the manufacture of transport equipment (–0.4%).
Compared to the same three months of the previous year (Q/Q–4), the turnover in manufacturing industry grew by 7.0%. It notably rose in the other manufacturing (+6.9%).
tableauIRtab5 – Turnover in industry and construction
| Nace Classification | Change in % | ||||
|---|---|---|---|---|---|
| Sectors | Weight** | Nov./ Oct. | Oct./ Sept. | Q/Q–1 (1) | Q/Q–4 (1) |
| BE : INDUSTRY | 8022 | 2,8 | –0,8 | 1,3 | 7,3 |
| CZ : MANUFACTURING | 7167 | 2,8 | –0,9 | 1,0 | 7,0 |
| Of which Exports | 1017 | 3,6 | –0,5 | 1,0 | 9,5 |
| (C1): Manufacture of food products and beverages | 1131 | 1,7 | 0,5 | 2,5 | 6,6 |
| (C2): Manufacture of coke and refined petroleum products | 461 | 13,9 | –12,6 | –1,3 | 9,1 |
| (C3): Electrical and electronic equipment; machine equipment | 927 | –0,6 | 0,7 | 2,3 | 8,6 |
| (C4): Manufacture of transport equipment | 1383 | 7,6 | –2,5 | –0,4 | 6,1 |
| (C5): Other manufacturing | 3265 | 0,9 | 0,2 | 1,0 | 6,9 |
| (DE): Mining and quarrying; energy; water supply; waste management | 855 | 3,0 | –0,1 | 3,2 | 8,9 |
| FZ: CONSTRUCTION | 1978 | 1,6 | –0,4 | 0,5 | –0,4 |
- ** 10000=B..F
- (1) Last three months / three previous months
- (2) Last three months / three same months of previous year
- The codes correspond to different levels of aggregation of the NACE classification.
- Source: INSEE
Documentation
Methodology (pdf,140 Ko)
Pour en savoir plus
Time series : Turnover indices (VAT)
