


 28 December 2010
2010- n° 318French GDP increased in Q3 (+0.3%) household purchasing power slightly accelerated
(+0.7% after +0.5%) Quarterly national accounts - detailed figures - 3rd Quarter 2010
28 December 2010
2010- n° 318French GDP increased in Q3 (+0.3%) household purchasing power slightly accelerated
(+0.7% after +0.5%) Quarterly national accounts - detailed figures - 3rd Quarter 2010
French GDP increased by 0.3% in the third quarter of 2010, after +0.6% in the previous quarter.
French GDP increased by 0.3% in the third quarter of 2010, after +0.6% in the previous quarter.
Households’ consumption expenditures accelerated
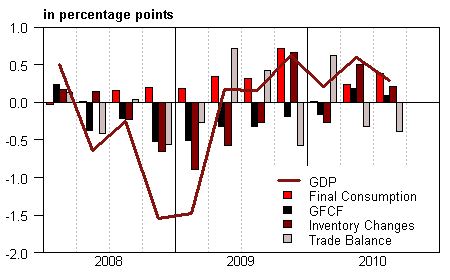
Production’s growth slightly decreased (+0.3% after +0.7%). Households’ consumption expenditures edged up (+0.5% after +0.3%) whereas total GFCF slowed down (+0.5% after +0.9%). Altogether, total domestic demand (excluding inventory changes) buoyantly contributed to GDP growth: +0.5 point after +0.4 point in the second quarter. Imports remained dynamic (+3.9% after +3.8%), more than exports (+2.6% after +2.7%). As a consequence, foreign trade balance deteriorated on the third quarter and negatively contributed to GDP growth (–0.4 point after –0.3 point). Inventory changes positively contributed to GDP growth: +0.2 point after +0.5 point.
GDP growth estimate revised in the third quarter. This mainly ensued from the revisions of GFCF indicators in business services and construction industry, and consumption indicators in personal services. Besides, GDP growth estimate also revised in the second quarter: +0.6%, whereas it was +0.7% in the publication of the 12th of november. This is primarily due to the revision of production indicator in transport.
* This growth rate is seasonally and trading-day adjusted; volumes are chain-linked previous-year-prices volumes.
graphiqueGraph1 – GDP and its main components
tableauTab1 – GOODS AND SERVICES: RESOURCES AND USES CHAIN-LINKED VOLUMES
| 2009 Q4 | 2010 Q1 | 2010 Q2 | 2010 Q3 | 2009 | 2010 (ovhg) | |
|---|---|---|---|---|---|---|
| GDP | 0.6 | 0.2 | 0.6 | 0.3 | -2.5 | 1.4 |
| Imports | 3.2 | 1.8 | 3.8 | 3.9 | -10.6 | 8.2 |
| Households' consumption expenditure | 1.0 | 0.0 | 0.3 | 0.5 | 0.6 | 1.4 |
| General government's consumption expenditure | 0.6 | -0.1 | 0.3 | 0.3 | 2.8 | 1.4 |
| GFCF | -0.9 | -0.8 | 0.9 | 0.5 | -7.0 | -1.8 |
| of which Non financial corporated and unincorporated enterprises | -1.0 | -0.9 | 1.2 | 0.5 | -7.9 | -1.7 |
| Households | -1.4 | -0.4 | 0.2 | 0.9 | -8.7 | -2.3 |
| General government | 0.1 | -1.4 | 0.9 | -0.3 | 0.6 | -0.8 |
| Exports | 1.1 | 4.7 | 2.7 | 2.6 | -12.2 | 9.6 |
| Contributions : | ||||||
| Internal demand excluding inventory changes | 0.5 | -0.1 | 0.4 | 0.5 | -0.5 | 0.8 |
| Inventory changes | 0.7 | -0.3 | 0.5 | 0.2 | -1.8 | 0.4 |
| Net foreign trade | -0.6 | 0.6 | -0.3 | -0.4 | -0.2 | 0.2 |
tableauTab2 – Sectoral accounts
| 2009 Q4 | 2010 Q1 | 2010 Q2 | 2010 Q3 | 2009 | 2010 (ovhg) | |
|---|---|---|---|---|---|---|
| Profit ratio of NFC* (level) | 29.2 | 29.7 | 29.5 | 29.7 | 29.8 | |
| Household purchasing power | 0.0 | 0.0 | 0.5 | 0.7 | 1.6 | 1.3 |
- *NFC : non-financial corporations
tableauTab5 – Household disposable income and household account ratios
| 2009 Q4 | 2010 Q1 | 2010 Q2 | 2010 Q3 | 2009 | 2010 (ovhg) | |
|---|---|---|---|---|---|---|
| HDI | 0.3 | 0.6 | 0.8 | 0.9 | 1.1 | 2.4 |
| Household purchasing power | 0.0 | 0.0 | 0.5 | 0.7 | 1.6 | 1.3 |
| HDI by ci* (purchasing power) | -0.2 | -0.2 | 0.3 | 0.5 | 0.8 | 0.6 |
| Adjusted HDI (purchasing power) | 0.2 | 0.0 | 0.5 | 0.6 | 1.6 | 1.4 |
| Saving rate (level) | 15.9 | 15.9 | 16.1 | 16.2 | 16.2 | |
| Financial saving rate (level) | 6.9 | 6.9 | 7.2 | 7.3 | 7.0 |
- * ci : consumption unit
Household purchasing power slightly increased this quarter
In nominal terms, households disposable income slightly increased (+0.9% after +0.8%). Wages kept increasing (+0.3% after +0.7%) but at a lower pace than past quarter because of the deceleration of wage per employee. On the contrary, taxes on income and wealth decreased (–1.3% after +1.1%) this quarter and offset the effect of the deceleration of wages. In particular, the income tax dropped this quarter with 2009 income declaration. Finally, social benefits in cash slew down (+0.7% after +0.8%).
In the same time, consumption price decelerated (+0.2% after +0.3%) stemming from the decrease of energy prices. As a whole, households purchasing power accelerated slightly (+0.7% after +0.5%).
Households disposable income increased more sharply than household consumption in nominal terms (+0.7%). As a consequence, household saving rate gained 0.1 point and reached 16.2%.
Non-financial corporation profit ratio increased this quarter
Value added of non financial corporations progressed this quarter at the same pace than last quarter (+1.0%). Wages paid (including social contributions) decelerated in the third quarter (+0.6% after +1.2%) because of the slow down of wages per employee (+0.3% after +0.9%) although employment grew at the same pace (+0.2%). As a whole, non-financial corporation profit ratio increased by 0.2 point and reached 29.7%.
Pour en savoir plus
