


 9 July 2010
2010- n° 180The commodities prices continued to decline in June Prices of oil and raw material imports - June 2010
9 July 2010
2010- n° 180The commodities prices continued to decline in June Prices of oil and raw material imports - June 2010
In June, the price of oil fell again (-1.3% after -10.7% in May) and stood on average at $ 74.7 per barrel.
In June, the price of oil fell again (-1.3% after -10.7% in May) and stood on average at $ 74.7 per barrel.
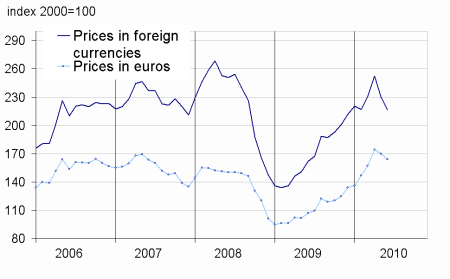
Prices for non-energy commodities imported by France declined again (-4.5% in foreign currencies, after -6.3% in May).
The price of oil continued to decline
In June, the dollar price of oil from the North Sea (Brent) decreased again (-1.3% after -10.7% in May). Conversely, in euros, the price increased slightly (+1.3 %) due to the depreciation of euro vis-à-vis the dollar (-2.6 %).
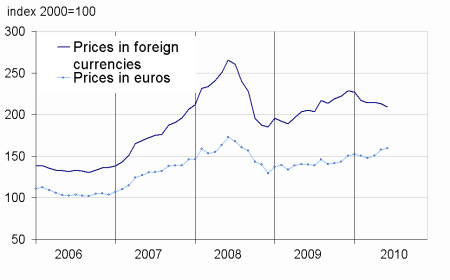
The Prices of industrial raw materials continued their decline
In June, the prices of industrial raw materials in foreign currencies were down again (-5.8% after -8.9% in May). On the one hand, the prices of mineral materials decreased (-5.4%). Those of non-ferrous metals prices were down (-6.7%), including nickel (-11,9%), zinc (-11.5%) and lead (-9.5%), in conjunction with a slowing chinese economy. The price of precious metals declined slightly (-0.2%) due to the declines in prices of platinum (-4.3%) and palladium (-6.7 %) while the price of gold rose (+2.3 %.
On the other hand, the prices of agricultural raw materials also declined (-7.0 %). The falling in the prices of sawn softwood (-23.9%) was somewhat compensated by higher prices for natural fiber textiles (+2.6%) and wood pulp (+1.9%).
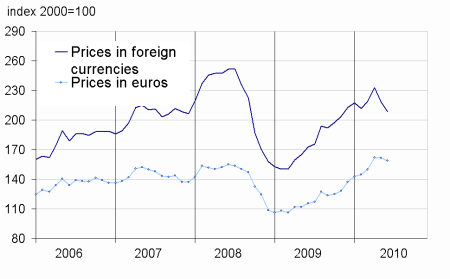
Continued decline in the prices of raw food materials
In June, prices of raw food in foreign currencies fell again (-1.8% after -0.8% in May). The decline in the prices of cereals accentuated (-3.6% after -0.5% in May). In partcular, corn prices fell by 4.8% due to a higher production than expected in the U.S.A. Oilseeds and vegetable oils prices also decreased (-1.0%), including those of sunflower oil (-2.5%) and olive oil (-3.4%). In contrast, the prices of tropicals beverages rebounded (+3.2% after -0.8% in May), due to higher coffee prices (+11.9% for arabica and +7.8% for robusta). The price of sugar also recovered (+8.3 % after -9.4 in May).
tableautabpetrole – Oil and petroleum products
| Prices | Changes (%) | |||
|---|---|---|---|---|
| of last month | over the last month | over the last 3 months | over the last 12 months | |
| Brent in $ per barrel | 74,7 | –1,3 | –5,2 | 9,1 |
| Brent in € per barrel | 61,1 | 1,3 | 5,3 | 25,1 |
| Gasoline | 703,7 | –2,6 | –8,7 | 3,3 |
| Gas Oil | 657,7 | 0,7 | –1,8 | 17,5 |
| Heavy fuel | 408,5 | –2,7 | –6,1 | 11,2 |
| Naphta | 651,9 | –4,5 | –10,6 | 15,7 |
- Prices are in dollars per tonne unless otherwise specified
- Source: INSEE
tableautabmatprem – Imported raw materials (excluding energy) in domestic currency
| Index | Changes (%) | |||
|---|---|---|---|---|
| over last month | over the last 3 months | over the last 12 months | ||
| Food total | 209,1 | –1,8 | –2,3 | 2,1 |
| Tropical beverages | 237,7 | 3,2 | 6,2 | 13,4 |
| Oil seeds, vegetable oils | 219,5 | –1,0 | –3,3 | –5,3 |
| Cereals | 196,3 | –3,6 | –10,2 | –15,8 |
| Sugar | 194,1 | 8,3 | –17,9 | 1,7 |
| Beef meat | 135,6 | –10,2 | –3,5 | 10,7 |
| Industrial raw materials | 216,5 | –5,8 | –6,0 | 33,5 |
| Agricultural raw materials | 141,3 | –7,0 | –7,2 | 37,9 |
| Natural Fibers | 181,8 | 2,6 | 4,8 | 45,9 |
| Natural rubber | 384,1 | 1,6 | –10,0 | 66,8 |
| Hides | 117,0 | 1,5 | 11,8 | 98,1 |
| Wood pulp | 142,0 | 1,9 | 9,6 | 58,0 |
| Tropical wood | 139,8 | 0,7 | 6,3 | 1,6 |
| Sawn softwood | 80,6 | –23,9 | –25,6 | 7,5 |
| Minerals | 255,3 | –5,4 | –5,5 | 31,9 |
| Iron ore | 612,7 | 0,0 | 74,7 | 74,7 |
| Non-ferrous metals | 219,3 | –6,7 | –13,7 | 26,3 |
| Precious metals | 310,3 | –0,2 | 6,1 | 31,4 |
| All commodities | 208,4 | –4,5 | –4,7 | 20,6 |
- Source: INSEE
graphiqueG_petrole_ang – Oil
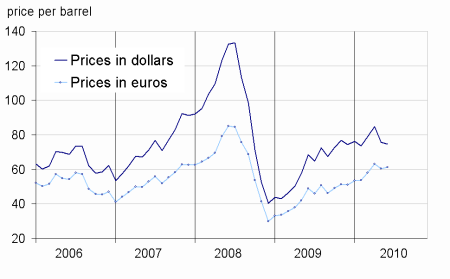
- Source: INSEE
graphiqueG_alim_ang – Food
- Source: INSEE
graphiqueG_ensemble_ang – All commodities
- Source: INSEE
graphiqueG_indus_ang – Industrial raw materials
- Source: INSEE
Pour en savoir plus
Time series : Raw materials prices
