


 21 January 2011
2011- n° 22In January 2011, the climate improves slightly in services Monthly survey of services - January 2011
21 January 2011
2011- n° 22In January 2011, the climate improves slightly in services Monthly survey of services - January 2011
From now on, this Informations Rapides issue includes a new turning point indicator. This indicator is described in the Conjoncture in France issue of December 2010.

From now on, this Informations Rapides issue includes a new turning point indicator. This indicator is described in the Conjoncture in France issue of December 2010.
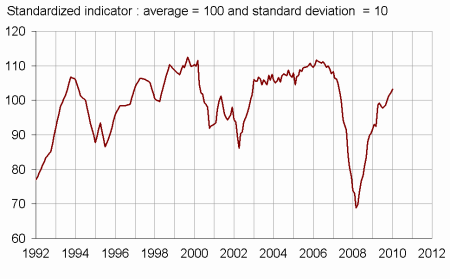
According to the business leaders surveyed in January, the economic situation in services continues to improve progressively. The business climate synthetic indicator has risen by one point per month since September 2010 and is 103 in January. The turning point indicator remains in the favourable area.
Activity was more sustained in the previous months, but it should decelerate slightly in the following months. Indeed, the business leaders surveyed consider that demand should be a little less favourable in the next few months, and they revise downwards their activity expectations.
They consider that their operating balance result accelerated in the recent months and that it should rise at the same pace in the months to come.
As for the general outlook, it remains almost unchanged.
graphiqueGraph1 – Business climate synthetic indicator
graphiquegraph_retourn – Turning point indicator
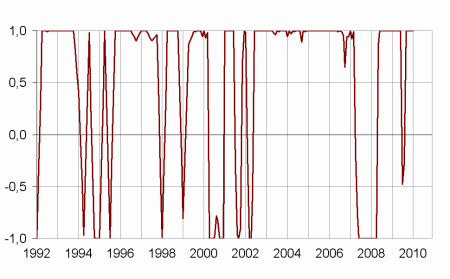
- Note: close to 1 (respectively -1), this indicator indicates a favourable short-term economic situation (respectively unfavourable).
tableauTable_quarter – Economic outlook in the services sector
| Average* | Oct. 10 | Nov. 10 | Dec. 10 | Jan. 11 | |
|---|---|---|---|---|---|
| Business climate synthetic indicator | 100 | 100 | 101 | 102 | 103 |
| General outlook | –5 | 0 | 1 | 0 | 1 |
| Past activity | 4 | 4 | 3 | 6 | 9 |
| Expected activity | 4 | 2 | 4 | 8 | 4 |
| Expected demand | 1 | 4 | 5 | 11 | 8 |
| Business situation | 1 | 1 | 0 | 5 | 3 |
| Past selling prices | –2 | –6 | –3 | –5 | –7 |
| Expected selling prices | –1 | –3 | –1 | 1 | 1 |
| Past employment | 3 | 5 | 12 | 12 | 7 |
| except temporary work agencies | 1 | –2 | 2 | 0 | 0 |
| Expected employment | 3 | 7 | 12 | 13 | 7 |
| except temporary work agencies | 0 | 0 | 2 | 3 | 0 |
| Investments | |||||
| Past investments | 2 | 0 | 2 | 0 | 6 |
| Expected investments | 1 | 5 | 2 | 2 | 1 |
| Operating balance result | |||||
| Past result | –1 | –4 | 3 | ||
| Expected result | 0 | –2 | 2 | ||
| Cash position | –10 | –10 | –9 | ||
| Difficulties of supply and demand | |||||
| difficulties of supply and demand | 9 | 9 | 9 | ||
| difficulties of supply only | 23 | 21 | 24 | ||
| difficulties of demand only | 29 | 33 | 29 | ||
| Difficulties in recruitment | 31 | 21 | 20 |
- * Average of the balances of opinion since 1988
- Source: Insee
Documentation
Methodology (2016) (pdf,158 Ko)
Pour en savoir plus
Time series : Economic outlook surveys – Services
