


 24 September 2010
2010- n° 232French GDP increased in Q2 (+0.7%) Quarterly national accounts - detailed figures - 2nd Quarter 2010
24 September 2010
2010- n° 232French GDP increased in Q2 (+0.7%) Quarterly national accounts - detailed figures - 2nd Quarter 2010
French GDP increased by 0.7% in the second quarter of 2010, after +0.2% in the previous quarter. Household purchasing power accelerated.
French GDP increased by 0.7% in the second quarter of 2010, after +0.2% in the previous quarter. Household purchasing power accelerated.
Total GFCF bounced
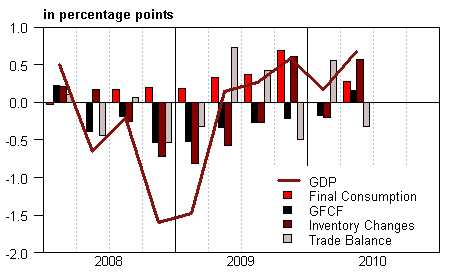
Production’s growth slightly increased (+0.8% after +0.3%). Total GFCF increased (+0.8% after –0.9%) after eight quarters of contraction. Households’ consumption’s expenditures edged up (+0.3% after 0.0%). Altogether, total domestic demand (excluding inventory changes) positively contributed to GDP growth : +0.4 points after –0.2 point in the first quarter. Foreign trade balance deteriorated on the second quarter and negatively contributed to GDP growth (–0.3 point after +0.6 point) : imports speeded up strongly (+3.9% after +2.0%) whereas exports decelerated (+2.8% after +4.5%). Inventory changes buoyantly contributed to activity’s soar : +0.6 point after –0.2 point.
Household purchasing power bounced
In nominal terms, households disposable income accelerated in Q2 (+0.9% after +0,6%). Wages accelerated with employment and activity. Besides income and wealth tax slowed down after having been particularly dynamic for two quarters. Finally, social benefits in cash grew again this quarter. Meantime, consumption price decelerated (+0.3% after +0.6%) with energy prices. As a consequence household purchasing power sharply increased (+0.6% after +0.1%). Household expenditure growth, in nominal terms, stabilized. The acceleration of households’ disposable income results in a slight increase of households saving rate which reached 16.1% after 15.8% in Q1.
Margin rate of non financial corporations slightly decreased this quarter
Value added of non financial corporations soared (+1.1% after 0.0%). Wages paid increased at the same pace. Employment and wages both accelerated this quarter. Taxes on production no longer supported the margin in Q1. Indeed, the suppression of local business tax was the main contribution to the increase of margin rate in Q1. As a whole, margin rate slightly decreased in Q2 (30.0% after 30.1%).
graphiqueGraph1 – GDP and its main components
tableauTab1 – GOODS AND SERVICES: RESOURCES AND USES CHAIN-LINKED VOLUMES
| 2009 Q3 | 2009 Q4 | 2010 Q1 | 2010 Q2 | 2009 | 2010 (ovhg) | |
|---|---|---|---|---|---|---|
| GDP | 0.3 | 0.6 | 0.2 | 0.7 | -2.5 | 1.3 |
| Imports | -0.2 | 2.8 | 2.0 | 3.9 | -10.6 | 6.2 |
| Households' consumption expenditure | 0.3 | 0.9 | 0.0 | 0.3 | 0.6 | 1.1 |
| General government's consumption expenditure | 0.8 | 0.6 | 0.0 | 0.4 | 2.8 | 1.3 |
| GFCF | -1.3 | -1.0 | -0.9 | 0.8 | -7.0 | -2.1 |
| of which Non financial corporated and unincorporated enterprises | -1.1 | -1.1 | -1.0 | 1.1 | -7.9 | -2.1 |
| Households | -1.9 | -1.5 | -0.5 | 0.1 | -8.7 | -2.9 |
| General government | -0.3 | 0.0 | -1.5 | 0.8 | 0.6 | -0.8 |
| Exports | 1.6 | 1.0 | 4.5 | 2.8 | -12.2 | 8.1 |
| Contributions : | ||||||
| Internal demand excluding inventory changes | 0.1 | 0.5 | -0.2 | 0.4 | -0.5 | 0.6 |
| Inventory changes | -0.3 | 0.6 | -0.2 | 0.6 | -1.8 | 0.4 |
| Net foreign trade | 0.4 | -0.5 | 0.6 | -0.3 | -0.2 | 0.3 |
* This growth rate is seasonally and trading-day adjusted; volumes are chain-linked previous-year-prices volumes.
Pour en savoir plus
