


 10 June 2010
2010- n° 152Payroll employment in Q1 2010: a slight rise Payroll employment - 1st quarter 2010
10 June 2010
2010- n° 152Payroll employment in Q1 2010: a slight rise Payroll employment - 1st quarter 2010
After a loss of 7,300 jobs in Q4 2009, payroll employment in principally market sectors went up in Q1: +23,900.
Payroll employment in principally market sectors up by 23,900 in Q1 2010
After a loss of 7,300 jobs in Q4 2009, payroll employment in principally market sectors went up in Q1: +23,900.
Employment increased by 0.2% q-o-q and decreased by 1.0% y-o-y in principally market sectors.
tableautableau_1_ – Payroll employment change in the competitive sector: thousands …
SA data in thousands
| Change in 3 months | Change in 1 year | Level | ||
|---|---|---|---|---|
| 2009 | 2010 | 2010 | 2010 | |
| Q4 | Q1 | Q1 | Q1 | |
| Total competitive sector (*) | 1.1 | 27.9 | -123.5 | 17748.1 |
| Principally market sectors | -7.3 | 23.9 | -154.7 | 15874.9 |
| Goods-producing industries excl. Construction | -31.3 | -29.1 | -153.4 | 3316.8 |
| Manufacturing | -33.2 | -29.4 | -156.3 | 2944.3 |
| Construction | -9.9 | 3.0 | -33.8 | 1438.5 |
| Services | 33.8 | 50.0 | 32.6 | 11119.6 |
| of which: Temporary employment | 23.5 | 30.4 | 85.4 | 524.0 |
| Principally non-market sectors | 8.5 | 4.0 | 31.2 | 1873.2 |
tableautableau_2_ – ... Percentage
SA data in %
| Change in 3 months | Change in 1 year | ||
|---|---|---|---|
| 2009 | 2010 | 2010 | |
| Q4 | Q1 | Q1 | |
| Total competitive sector (*) | 0.0 | 0.2 | -0.7 |
| Principally market sectors | 0.0 | 0.2 | -1.0 |
| Goods-producing industries excl. Construction | -0.9 | -0.9 | -4.4 |
| Manufacturing | -1.1 | -1.0 | -5.0 |
| Construction | -0.7 | 0.2 | -2.3 |
| Services | 0.3 | 0.5 | 0.3 |
| of which : Temporary employment | 5.0 | 6.2 | 19.5 |
| Principally non-market sectors | 0.5 | 0.2 | 1.7 |
- (*) Excl. Agriculture and public employees in non-markets sectors (administration, health, education and social activity); na: not available
- Source: INSEE
tableautableau_4_ – Payroll employment change in the competitive sector (*)
SA data in thousands
| Code | Change in 3 months | Change in 1 year | Level | ||
|---|---|---|---|---|---|
| Naf | 2009 | 2010 | 2010 | 2010 | |
| rev.2 | Q4 | Q1 | Q1 | Q1 | |
| DE | Electricity, gas, steam, and air conditioning supply ; water supply, sewerage, waste management and remediation activities | 1.9 | 0.4 | 2.9 | 372.5 |
| C1 | Manufacture of food products beverage and tobacco products | 0.3 | 0.0 | -2.2 | 549.4 |
| C2 | Manufacture of coke, and refined petroleum products | 0.0 | -0.2 | -0.4 | 11.9 |
| C3 | Manufacture of computer, electronic and electrical products; manufacture of machinery and equipment | -6.4 | -5.6 | -29.4 | 479.6 |
| C4 | Manufacture of transport equipment | -4.8 | -10.5 | -27.9 | 347.6 |
| C5 | Other manufacturing | -22.3 | -13.1 | -96.5 | 1555.8 |
| FZ | Construction | -9.9 | 3.0 | -33.8 | 1438.5 |
| GZ | Wholesale and retail trade ; repair of motor vehicles and motorcycles | 0.8 | 9.5 | -23.5 | 2971.4 |
| HZ | Transportation and storage | -3.7 | -6.5 | -28.0 | 1316.9 |
| IZ | Acommodation and food service activities | 8.3 | 12.3 | 22.9 | 933.5 |
| JZ | Information and communication | -6.3 | -4.0 | -27.5 | 662.4 |
| KZ | Financial and insurance activities | 0.9 | 4.2 | 3.9 | 828.9 |
| LZ | Real estate activities | 0.5 | 2.6 | -1.7 | 234.3 |
| MN | Professional, scientific and technical activities; administrative and support service activities | 23.3 | 23.6 | 69.1 | 2801.9 |
| of which : Temporary employment | 23.5 | 30.4 | 85.4 | 524.0 | |
| OQ | Public administration and defence ; compulsory social security; education; human health and social work activities | 8.5 | 4.0 | 31.2 | 1873.2 |
| RU | Other service activities | 10.0 | 8.3 | 17.4 | 1370.4 |
- (*) Excl. Agriculture and public employees in non-markets sectors (administration, health, education and social activity)
- Source: INSEE
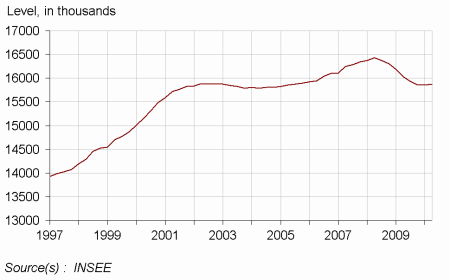
graphiqueGraph1_ – Payroll employment in principally market sectors
Documentation
Methodology (pdf,135 Ko)
Pour en savoir plus
: bureau-de-presse@insee.fr
