


 12 November 2010
2010- n° 278French GDP increased in Q3 (+0.4%) Quarterly national accounts - second estimate - 3th Quarter 2010
12 November 2010
2010- n° 278French GDP increased in Q3 (+0.4%) Quarterly national accounts - second estimate - 3th Quarter 2010
French GDP increased by 0.4% in the third quarter of 2010, after +0.7% in the previous quarter.
French GDP increased by 0.4% in the third quarter of 2010, after +0.7% in the previous quarter.
Households’ consumption expenditures accelerated
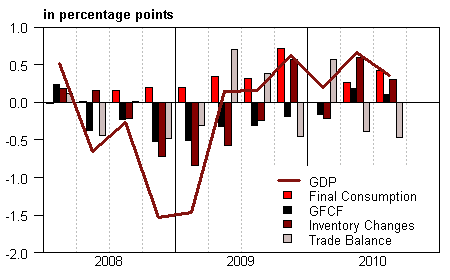
Production’s growth slightly decreased (+0.4% after +0.8%). Households’ consumption expenditures edged up (+0.6% after 0.3%) whereas total GFCF slowed down (+0.5% after +0.9%). Altogether, total domestic demand (excluding inventory changes) buoyantly contributed to GDP growth: +0.5 point after +0.4 point in the second quarter. Imports remained dynamic (+4.1% after +3.9%), more than exports (+2.5% after +2.6%). As a consequence, foreign trade balance deteriorated on the third quarter and negatively contributed to GDP growth (–0.5 point after -0.4 point). Inventory changes positively contributed to GDP growth: +0.3 point after +0.6 point. This mainly ensued from energy and intermediate goods.
* This growth rate is seasonally and trading-day adjusted; volumes are chain-linked previous-year-prices volumes.
graphiqueGraph1 – GDP and its main components
tableauTab1 – GOODS AND SERVICES: RESOURCES AND USES CHAIN-LINKED VOLUMES
| 2009 Q4 | 2010 Q1 | 2010 Q2 | 2010 Q3 | 2009 | 2010 (ovhg) | |
|---|---|---|---|---|---|---|
| GDP | 0.6 | 0.2 | 0.7 | 0.4 | -2.5 | 1.5 |
| Imports | 2.9 | 1.8 | 3.9 | 4.1 | -10.6 | 8.2 |
| Households' consumption expenditure | 1.0 | 0.0 | 0.3 | 0.6 | 0.6 | 1.5 |
| General government's consumption expenditure | 0.6 | -0.1 | 0.3 | 0.4 | 2.8 | 1.3 |
| GFCF | -0.9 | -0.9 | 0.9 | 0.5 | -7.0 | -1.7 |
| of which Non financial corporated and unincorporated enterprises | -1.0 | -1.0 | 1.2 | 0.5 | -7.9 | -1.7 |
| Households | -1.4 | -0.5 | 0.2 | 1.0 | -8.7 | -2.3 |
| General government | 0.1 | -1.4 | 0.9 | -0.2 | 0.6 | -0.8 |
| Exports | 1.3 | 4.4 | 2.6 | 2.5 | -12.2 | 9.2 |
| Contributions : | ||||||
| Internal demand excluding inventory changes | 0.5 | -0.2 | 0.4 | 0.5 | -0.5 | 0.8 |
| Inventory changes | 0.6 | -0.2 | 0.6 | 0.3 | -1.8 | 0.6 |
| Net foreign trade | -0.5 | 0.6 | -0.4 | -0.5 | -0.2 | 0.1 |
Pour en savoir plus
Time series : Operations on goods and services
Time series : Gross domestic product balance
Time series : Institutional sector accounts
Time series : Branch accounts
