


 9 September 2010
2010- n° n° Rise of payroll employment in Q2 2010 Payroll employment - 2nd Quarter 2010
9 September 2010
2010- n° n° Rise of payroll employment in Q2 2010 Payroll employment - 2nd Quarter 2010
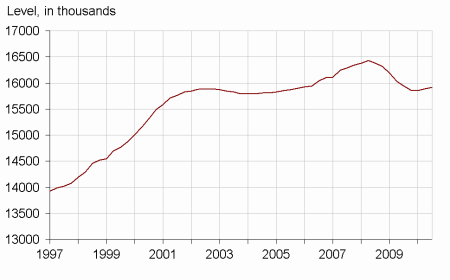
After +35,900 jobs in Q1 2010, payroll employment in principally market sectors went up in Q2: +24,000.
Payroll employment in principally market sectors up by 24,000 in Q2 2010
After +35,900 jobs in Q1 2010, payroll employment in principally market sectors went up in Q2: +24,000.
Employment increased by 0.2% q-o-q and decreased by 0.2% y-o-y in principally market sectors.
tableautableau_1_ – Payroll employment change in the competitive sector : thousands …
SA data in thousands
| Change in 3 months | Change in 1 year | Level | ||
|---|---|---|---|---|
| 2010 | 2010 | 2010 | 2010 | |
| Q1 | Q2 | Q2 | Q2 | |
| Total competitive sector (*) | 38,9 | 26,2 | 4,3 | 17793,5 |
| Principally market sectors | 35,9 | 24,0 | –27,3 | 15913,8 |
| Goods-producing industries excl. Construction | –24,6 | –17,2 | –122,0 | 3300,8 |
| Manufacturing | –25,3 | –18,1 | –126,7 | 2925,8 |
| Construction | –0,1 | –6,2 | –30,4 | 1430,4 |
| Services | 60,7 | 47,4 | 125,1 | 11182,7 |
| of which : Temporary employment | 29,1 | 27,6 | 103,0 | 550,0 |
| Principally non-market sectors | 2,9 | 2,2 | 31,6 | 1879,6 |
tableautableau_2_ – ... Percentage
SA data in %
| Change in 3 months | Change in 1 year | ||
|---|---|---|---|
| 2010 | 2010 | 2010 | |
| Q1 | Q2 | Q2 | |
| Total competitive sector (*) | 0,2 | 0,1 | 0,0 |
| Principally market sectors | 0,2 | 0,2 | –0,2 |
| Goods-producing industries excl. Construction | –0,7 | –0,5 | –3,6 |
| Manufacturing | –0,9 | –0,6 | –4,2 |
| Construction | 0,0 | –0,4 | –2,1 |
| Services | 0,5 | 0,4 | 1,1 |
| of which : Temporary employment | 5,9 | 5,3 | 23,1 |
| Principally non-market sectors | 0,2 | 0,1 | 1,7 |
- (*) Excl. Agriculture and public employees in non-markets sectors (administration, health, education and social activity) ; na : not available
- Source : INSEE
tableau – Payroll employment change in the competitive sector (*)
SA data in thousands
| Code | Change in 3 months | Change in 1 year | Level | ||
|---|---|---|---|---|---|
| Naf | 2010 | 2010 | 2010 | 2010 | |
| rev.2 | Q1 | Q2 | Q2 | Q2 | |
| DE | Electricity, gas, steam, and air conditioning supply ; water supply, sewerage, waste management and remediation activities | 0,8 | 0,9 | 4,7 | 374,9 |
| C1 | Manufacture of food products beverage and tobacco products | –0,9 | 0,3 | –4,4 | 548,3 |
| C2 | Manufacture of coke, and refined petroleum products | –0,2 | –0,2 | –0,4 | 11,7 |
| C3 | Manufacture of computer, electronic and electrical products; manufacture of machinery and equipment | –7,0 | –3,6 | –25,0 | 472,6 |
| C4 | Manufacture of transport equipment | –5,3 | –3,4 | –22,1 | 349,7 |
| C5 | Other manufacturing | –12,0 | –11,3 | –74,8 | 1543,6 |
| FZ | Construction | –0,1 | –6,2 | –30,4 | 1430,4 |
| GZ | Wholesale and retail trade ; repair of motor vehicles and motorcycles | 6,6 | –3,1 | –14,0 | 2966,6 |
| HZ | Transportation and storage | –7,2 | 0,6 | –21,0 | 1315,5 |
| IZ | Accommodation and food service activities | 10,3 | 9,1 | 29,5 | 939,7 |
| JZ | Information and communication | 9,2 | 0,8 | 0,0 | 681,4 |
| KZ | Financial and insurance activities | 6,2 | 3,8 | 10,4 | 836,9 |
| LZ | Real estate activities | 1,9 | 0,4 | 0,1 | 233,9 |
| MN | Professional, scientific and technical activities; administrative and support service activities | 24,5 | 39,4 | 104,9 | 2839,8 |
| of which : Temporary employment | 29,1 | 27,6 | 103,0 | 550,0 | |
| OQ | Public administration and defence ; compulsory social security; education; human health and social work activities | 2,9 | 2,2 | 31,6 | 1879,6 |
| RU | Other service activities | 9,1 | –3,7 | 15,2 | 1369,0 |
- (*) Excl. Agriculture and public employees in non-markets sectors (administration, health, education and social activity)
- Source : INSEE
graphiqueGraph1_ – Payroll employment in principally market sectors
- INSEE
Documentation
Methodology (pdf,135 Ko)
Pour en savoir plus
: bureau-de-presse@insee.fr
