


 17 February 2010
2010- n° 45A decrease in enterprise births in January 2010 Enterprise births - January 2010
17 February 2010
2010- n° 45A decrease in enterprise births in January 2010 Enterprise births - January 2010
Warning: From the August issue, only enterprise births data excluding self-managed enterprises (SME) are seasonally adjusted. In order to get the total of enterprise births, the raw number of SME is added. The SME time series is too short to be properly deseasonalized.
Warning : From the August issue, only enterprise births data excluding self-managed enterprises (SME) are seasonally adjusted. In order to get the total of enterprise births, the raw number of SME is added. The SME time series is too short to be properly deseasonalized.
In January 2010, the number of enterprise births decreased compared to December 2009: -27.4% for enterprise births excluding self-managed enterprises (seasonally and working-day adjusted data); -7.7% when the number of self-managed enterprises (raw data) is added.
+89.3% year-on-year (quarterly basis)
The amount of entries, added up November 2009, December 2009 and January 2010, went up 89.3% compared to the same quarter one year before, a quarter when there were just a few self-managed enterprises.
The sectors that most contributed to that raise were service activities and wholesale and retail trade.
+78.6% year-on-year (twelve months basis)
During the last twelve months, the number of births climbed by 78.6% year-on-year.
31,605 self-managed enterprises in January 2010
In January 2010, more than one out of two births enterprises were self-managed enterprises (31,605).
tableautab0EN – Self-managed entreprise births
| Oct. 2009 | Nov. 2009 | Déc. 2009 | Jan. 2010 |
|---|---|---|---|
| 32 633 | 28 615 | 28 413 | 31 605 |
- Source: INSEE (Sirene)
tableautab1EN – Enterprise births by month
| Oct. 2009 | Nov. 2009 | Dec. 2009 | Jan. 2010 | |
|---|---|---|---|---|
| Excl. self-managed enterprises (sa-wda *) | 20 596 | 22 194 | 27 221 | 19 757 |
| Variation [m-o-m] % | -15.3 | 7.8 | 22.7 | -27.4 |
| Incl. self-managed enterprises (in raw data) | 53 229 | 50 809 | 55 634 | 51 362 |
| Variation [m-o-m] % | -5.1 | -4.5 | 9.5 | -7.7 |
- * Seasonally and working-day adjusted data
- Source: INSEE (Sirene)
tableautab2EN – Enterprise births by type
| Moving total % change* | Moving total | Moving total | ||
|---|---|---|---|---|
| over 3 months | over 12 months | January 2010 | January 2009 | |
| Total | 89.3 | 78.6 | 55 075 | 37 485 |
| Companies | 18.8 | -2.7 | 14 366 | 12 675 |
| Individual enterprises | 143.5 | 151.4 | 40 709 | 24 810 |
| Of which self-managed | // | // | 31 605 | 12 553 |
- * Total of enterprises births during the last 3 or 12 months compared with the same months a year earlier.
- // = meaningless.
- Source: INSEE (Sirene)
graphiqueGraph1EN – Enterprise births
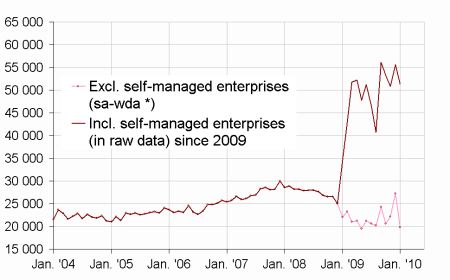
- * Seasonally and working-day adjusted data
- Source: INSEE (Sirene)
Pour en savoir plus
Time series : Business demography
