


 5 February 2010
2010- n° 40The prices of oil and raw materials rose in January Prices of oil and raw material imports - January 2010
5 February 2010
2010- n° 40The prices of oil and raw materials rose in January Prices of oil and raw material imports - January 2010
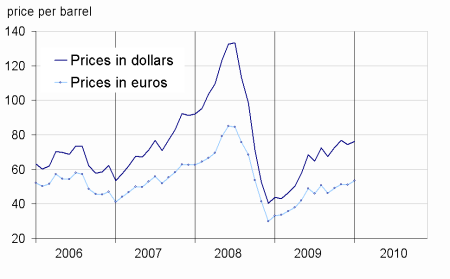
In January, oil price rose 2.4% after falling 2.9% in December. The price of barrel settled at $76.2; compared to January 2009, it rose by 73.8%.
In January, oil price rose 2.4% after falling 2.9% in December. The price of barrel settled at $76.2; compared to January 2009, it rose by 73.8%.
Prices for non-energy commodities imported by France rose again (+3.3% after +4.6% in December).
Oil prices rose
In January, the price of oil from the North Sea (Brent) increased again (+2.4% after -2.9% in December). The harsh winter in the Northern Hemisphere has supported oil prices. In euros, the increase was more pronounced (+4.5 %) due to the depreciation of the euro vis-à-vis the dollar (-2.1 %).
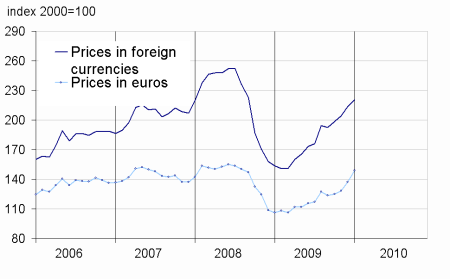
Prices of industrial materials continued to rise
In January, prices of industrial materials in foreign currencies increased again (+4.2% after +5.3% in December). On the one hand, the prices of minerals increased by +4.0%), driven by higher prices of non-ferrous metals (+4.2%), including titanium (+10.6%), nickel (+7.6%) and copper (+5.7%). Similary, the prices of precious metals appreciated strongly (+6.6 %): increases in the prices of palladium (+15.8 %) and platinum (+8.3 %) outweighed the fall in gold (–1.5 %).
On the other hand, the prices of agro-industrial materials continued to grow (+4.7 %), includind wool (+8.6), natural rubber (+7.4 %) and wood sawn coniferous (+5.7 %).
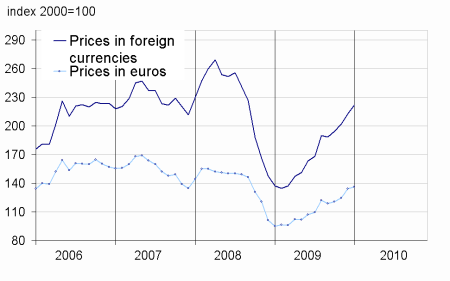
Raw food materials prices decreased
In January, prices of raw food in foreign currencies declined (-0.9% after +3.0% in December). The prices of tropical beverages fell to 2.5 % (after +4.0 % in December) due to a fall of 15.1 % of the price of tea: a more favorable weather than expected generated an excess production of tea in Kenya. Oilseeds prices declined also (-1.9 %), in conjunction with the falling prices of olive oil (-3.0 %) and soybean (-4.7 % for soybeans and -3.0 % for soybean meal). However, prices of cereals stagnated (+0.0 %). Finally, sugar prices rose sharply (+14.0 %) because of lower production in Brazil and India.
tableautabpetrole – Oil and petroleum products
| Prices | Change (%) | |||
|---|---|---|---|---|
| of last month | over the last month | over the last 3 months | over the last 12 months | |
| Brent in $ per barrel | 76,2 | 2,4 | 4,7 | 73,8 |
| Brent in € per barrel | 53,4 | 4,5 | 8,7 | 61,3 |
| Gasoline | 704,0 | 5,9 | 6,7 | 82,7 |
| Gas Oil | 631,6 | 3,7 | 3,1 | 34,9 |
| Heavy fuel | 442,7 | 4,5 | 7,1 | 107,3 |
| Naphta | 713,3 | 4,7 | 15,0 | 106,0 |
- Prices are in dollars per tonne unless otherwise specified
- Source: INSEE
tableautabmatprem – Imported raw materials (excluding energy) in domestic currency
| Index | Changes (%) | |||
|---|---|---|---|---|
| over last month | over the last 3 months | over the last 12 months | ||
| Food total | 226,8 | –0,9 | 3,4 | 15,8 |
| Tropical beverages | 253,8 | –2,5 | 0,8 | 24,3 |
| Oil seeds, vegetable oils | 234,3 | –1,9 | 3,5 | 10,1 |
| Cereals | 242,0 | 0,0 | 9,8 | 3,6 |
| Sugar | 348,4 | 14,0 | 22,5 | 131,8 |
| Beef meat | 126,7 | 5,1 | 4,5 | –1,8 |
| Industrial raw materials | 221,5 | 4,2 | 14,1 | 61,8 |
| Agricultural raw materials | 137,1 | 4,7 | 17,7 | 46,9 |
| Natural Fibers | 160,3 | 2,3 | 13,8 | 40,9 |
| Natural rubber | 408,7 | 7,4 | 31,4 | 98,5 |
| Hides | 99,0 | 4,7 | 21,3 | 74,8 |
| Wood pulp | 119,8 | 2,4 | 9,6 | 33,2 |
| Tropical wood | 131,9 | –0,3 | –2,2 | –2,8 |
| Sawn softwood | 90,4 | 5,7 | 23,4 | 50,6 |
| Minerals | 266,0 | 4,0 | 13,0 | 67,1 |
| Iron ore | 350,6 | 0,0 | 0,0 | 0,0 |
| Non-ferrous metals | 248,6 | 4,2 | 14,4 | 82,8 |
| Precious metals | 352,0 | 6,6 | 15,8 | 55,6 |
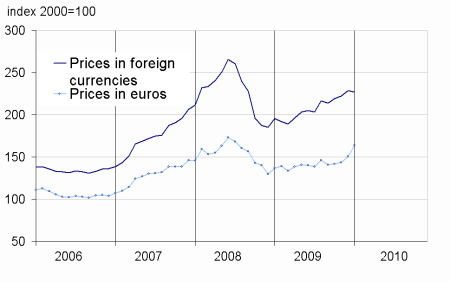
| All commodities | 220,6 | 3,3 | 11,2 | 43,8 |
- Source: INSEE
graphiqueG_petrole_ang – Oil
- Source: INSEE
graphiqueG_alim_ang – Food
- Source: INSEE
graphiqueG_ensemble_ang – All commodities
- Source: INSEE
graphiqueG_indus_ang – Industrial raw materials
- Source: INSEE
Pour en savoir plus
Time series : Raw materials prices
