


 29 December 2009
2009- n° 336French GDP increased in Q3 (+0,3%) Quarterly national accounts - detailed figures - Third Quarter 2009
29 December 2009
2009- n° 336French GDP increased in Q3 (+0,3%) Quarterly national accounts - detailed figures - Third Quarter 2009
In the third quarter of 2009, French GDP increase in volume is confirmed (+0.3%*, as in the second quarter).
In the third quarter of 2009, French GDP increase in volume is confirmed (+0.3%*, as in the second quarter).
Foreign trade balance, still a driving force behind GDP growth
As exports grew (+1.7% after +0.4%) faster than imports (+0.4% after –2.6%), foreign trade balance once more contributed positively to GDP growth (+0.3%), but less than in the previous quarter (+0.8%).
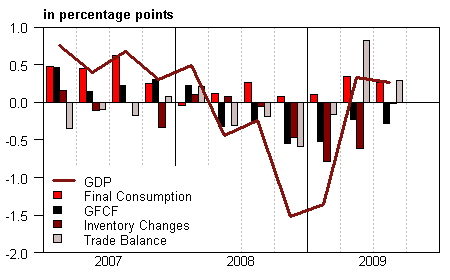
Households consumption's expenditures slightly increased (+0.1% after +0.4%) whereas total GFCF went down again (–1.4% after –1.0%). Thus, total domestic demand (excluding inventory changes) did not contribute to GDP growth (after +0.1% in Q2). Inventory changes were neutral on activity this quarter (after –0.6%).
Purchasing power of households' gross disposable income grew again
Purchasing power of households' gross disposable income grew by +0.6% (after +1.1% in Q2). On one hand, social benefits in cash sharply slowed down (+0.4% after +3.0%) because households no longer benefited from the payment of the two one-off bonuses as part of the stimulus package; unemployment benefits decelerated; and prices went slightly up (+0.2% after +0.0%). On the other hand, wages increased (+0.2% after +0.0% in Q2) and income taxes dropped.
Households consumption's expenditures at real prices increased less sharply and saving rate jumped to 17.0%.
Non financial corporations’ margin ratio increased by 0.2 points to 30.6%: added value went up by 0.6% (after +0.5% in Q2) whereas wages paid increased by 0.1% (after –0.1% in Q2).
* This growth rate is seasonally and trading-day adjusted; volumes are chain-linked previous-year-prices volumes.
graphiqueGraph1 – GDP and its main components
tableauTab1 – GOODS AND SERVICES: RESOURCES AND USES CHAIN-LINKED VOLUMES
| ovhg | ||||||
|---|---|---|---|---|---|---|
| 2008 Q4 | 2009 Q1 | 2009 Q2 | 2009 Q3 | 2008 | 2009 | |
| GDP | -1,5 | -1,4 | 0,3 | 0,3 | 0,3 | -2,3 |
| Imports | -3,5 | -5,9 | -2,6 | 0,4 | 0,6 | -10,2 |
| Households' consumption expenditure | 0,0 | 0,2 | 0,4 | 0,1 | 0,9 | 0,6 |
| General government's consumption expenditure | 0,3 | 0,0 | 0,5 | 0,7 | 1,1 | 1,4 |
| GFCF | -2,5 | -2,4 | -1,0 | -1,4 | 0,4 | -6,6 |
| of which Non financial corporated and unincorporated enterprises | -2,9 | -3,3 | -1,1 | -1,0 | 2,4 | -7,4 |
| Households | -2,6 | -1,7 | -1,6 | -2,3 | -1,4 | -7,5 |
| General government | -1,7 | -0,8 | 0,2 | -1,0 | -4,5 | -3,8 |
| Exports | -6,1 | -7,3 | 0,4 | 1,7 | -0,6 | -11,3 |
| Contributions : | ||||||
| Internal demand excluding inventory changes | -0,5 | -0,4 | 0,1 | 0,0 | 0,9 | -0,7 |
| Inventory changes | -0,5 | -0,8 | -0,6 | 0,0 | -0,3 | -1,6 |
| Net foreign trade | -0,6 | -0,2 | 0,8 | 0,3 | -0,3 | 0,0 |
Pour en savoir plus
