


 27 October 2009
2009- n° n° Production capacity more intensely used in Q3 2009 in manufacturing industry Quarterly business survey (goods-producing industries) - October 2009
27 October 2009
2009- n° n° Production capacity more intensely used in Q3 2009 in manufacturing industry Quarterly business survey (goods-producing industries) - October 2009
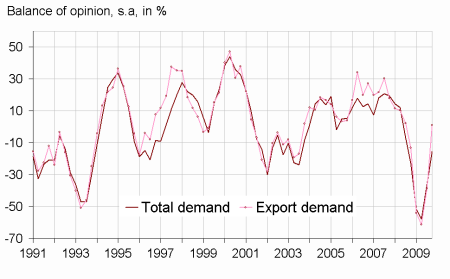
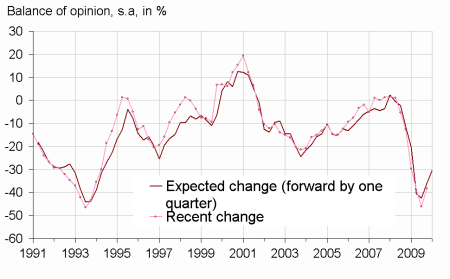
According to the business leaders questioned to the quarterly survey of October 2009, the balance of opinion regarding global demand continued to improve. Looking at business leader’s expectations, It would improve again in Q4 2009.
Manufacturing industry
According to the business leaders questioned to the quarterly survey of October 2009, the balance of opinion regarding global demand continued to improve. Looking at business leader’s expectations, It would improve again in Q4 2009.
The balance of opinion regarding export demand increased more strongly, and reached its long term average. It woud remain near this level in the next three month.
Production capacity was sligthly more intensely used in Q3 2009: the proportion of businesses encountering production bottlenecks improve for the first time since the end of 2007.
According to the business leaders, the fall of industrial manpower attenuated in Q3 2009. Looking at business leader’s expectations, the decline in employment is expected to be less marked again over the next three months.
tableauTableau 1 – Business leaders' opinion : Demand and production factors
| Manufacturing industry | MOY* | Jan. 09 | Apr. 09 | Jul. 09 | Oct. 09 |
|---|---|---|---|---|---|
| Total demand | |||||
| Recent changes | 0 | -52 | -58 | -36 | -15 |
| Expected change | 0 | -44 | -37 | -18 | -9 |
| Export demand | |||||
| Recent changes | 2 | -54 | -61 | -39 | 1 |
| Expected change | 4 | -45 | -33 | -7 | 0 |
| Production factors | |||||
| Share of firms producing at full capacity (in%) | 21 | 21 | 11 | 7 | 14 |
| Opinion on production capacity | 16 | 35 | 40 | 35 | 37 |
| Productive capacity utilization rate (in %) | 84 | 75 | 70 | 71 | 73 |
| Difficulties of supply and demand | |||||
| Difficulties of supply and demand | 6 | 11 | 14 | 15 | 12 |
| Difficulties of supply | 23 | 9 | 6 | 6 | 7 |
| Difficulties of demand | 43 | 57 | 62 | 62 | 63 |
- * : Long period average.
- Source : Quarterly business survey - INSEE
graphiqueGraph1ang – Recent changes in demand
graphiqueGraph3ang – Workforce in manufacturing industry
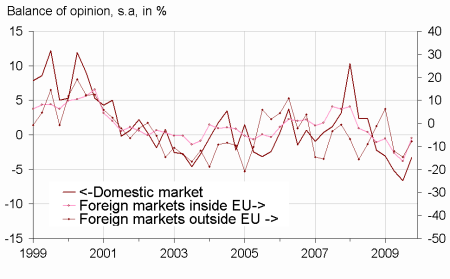
graphiqueGraph4ang – Competitive position
Documentation
Methodology (pdf,48 Ko)
Pour en savoir plus
Time series : Industry
