


 30 December 2009
2009- n° 337The public debt reached 1457.4 billion euros Debt of the general government according to the Maastricht definition - Third Quarter
2009
30 December 2009
2009- n° 337The public debt reached 1457.4 billion euros Debt of the general government according to the Maastricht definition - Third Quarter
2009
At the end of the third quarter of 2009, the public debt, which is a gross debt, reached 1457.4 billon euros, a 29.4 billion euros rise compared to Q2 2009. As a pourcentage of GDP, the debt amounted approximately to 75.8%, +1.9 point compared to Q2 2009. The growth of the general governement net debt was lower and represented approximately 69.3% of the GDP, +3.3 points compared to Q2 2009.
A 29.4 billion euros increase of the public debt
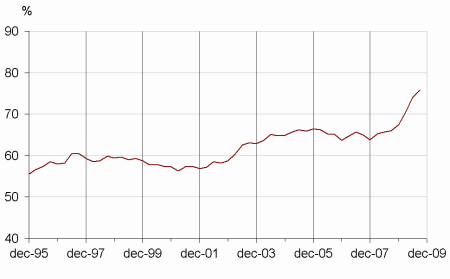
At the end of the third quarter of 2009, the public debt, which is a gross debt, reached 1457.4 billion euros, a 29.4 billion euros rise compared to Q2 2009. As a percentage of GDP, the debt amounted approximately to 75.8%, +1.9 point compared to Q2 2009. The growth of the general governement net debt was lower and represented approximately 69.3% of the GDP, +3.3 points compared to Q2 2009.
graphiqueGraphIR_EN – Debt of the general government according to the Maastricht definition (% of GDP)
tableauTableau1 – The debt of the general government according to the Maastricht definition at the end of Q3 2009 by sub-sector and by instrument category
| Q3 2008 | Q4 2008 | Q1 2009 | Q2 2009 | Q3 2009 | |
|---|---|---|---|---|---|
| General government | 1284.2 | 1314.1 | 1366.9 | 1428.0 | 1457.4 |
| % of GDP | 66.0% | 67.4% | 70.5% | 74.0% | 75.8% |
| of which, by sub-sector: | |||||
| State | 996.2 | 1036.2 | 1080.7 | 1135.4 | 1158.8 |
| Central agencies | 94.8 | 96.1 | 109.3 | 109.8 | 109.4 |
| Local government | 134.3 | 146.7 | 142.9 | 141.1 | 141.6 |
| Social security funds | 59.0 | 35.1 | 34.0 | 41.7 | 47.6 |
| of which, by category: | |||||
| Currency and deposits | 16.0 | 23.5 | 20.7 | 19.1 | 19.8 |
| Securities other than shares | 1070.3 | 1104.1 | 1167.2 | 1224.2 | 1249.3 |
| of which: | |||||
| Short-term securities | 150.4 | 178.3 | 218.4 | 228.2 | 265.9 |
| Long-term securities | 920.0 | 925.8 | 948.9 | 996.0 | 983.4 |
| Loans | 197.9 | 186.6 | 179.0 | 184.7 | 188.3 |
| of which: | |||||
| Short-term loans | 46.3 | 16.5 | 17.1 | 23.3 | 25.9 |
| Long-term loans | 151.6 | 170.1 | 161.9 | 161.3 | 162.4 |
- Source: National accounts - Insee, DGFiP, Banque de France
Pour en savoir plus
