


 10 December 2009
2009- n° 320Payroll employment down by 93,100 in Q3 2009 Payroll employment - Third Quarter 2009
10 December 2009
2009- n° 320Payroll employment down by 93,100 in Q3 2009 Payroll employment - Third Quarter 2009
After a loss of 93,500 jobs in Q2 2009, payroll employment in principally market sectors went down too in Q3: –93,500 (–5,500 initially announced).
Payroll employment in principally market sectors down by 93,100 in Q3 2009
After a loss of 93,500 jobs in Q2 2009, payroll employment in principally market sectors went down too in Q3: –93,500 (–5,500 initially announced).
In the principally market sectors, employment decreased by 0.6% q-o-q and by 2.7% y-o-y.
tableauTableau 1 – Payroll employment change in the competitive sector : thousands …
SA data in thousands
| Change in 3 months | Change in 1 year | Level | ||
|---|---|---|---|---|
| 2009 | 2009 | 2009 | 2009 | |
| Q2 | Q3 | Q3 | Q3 | |
| Total competitive sector (*) | -87,0 | -80,7 | -408,6 | 17918,2 |
| Principally market sectors | -93,5 | -93,1 | -447,3 | 16058,5 |
| Goods-producing industries excl. Construction | -49,5 | -49,4 | -173,0 | 3365,4 |
| Manufacturing | -49,6 | -49,1 | -176,8 | 2993,4 |
| Construction | -11,8 | -16,1 | -49,5 | 1439,8 |
| Services | -32,2 | -27,7 | -224,7 | 11253,3 |
| of which : Temporary employment | 2,5 | 36,9 | -121,5 | 473,5 |
| Principally non-market sectors | 6,5 | 12,5 | 38,7 | 1859,7 |
tableauTableau 2 – ... Percentage
SA data in %
| Change in 3 months | Change in 1 year | ||
|---|---|---|---|
| 2009 | 2009 | 2009 | |
| Q2 | Q3 | Q3 | |
| Total competitive sector (*) | -0,5 | -0,4 | -2,2 |
| Principally market sectors | -0,6 | -0,6 | -2,7 |
| Goods-producing industries excl. Construction | -1,4 | -1,4 | -4,9 |
| Manufacturing | -1,6 | -1,6 | -5,6 |
| Construction | -0,8 | -1,1 | -3,3 |
| Services | -0,3 | -0,2 | -2,0 |
| of which: Temporary employment | 0,6 | 8,5 | -20,4 |
| Principally non-market sectors | 0,4 | 0,7 | 2,1 |
- (*) Excl. Agriculture and public employees in non-markets sectors (administration, health, education and social activity) ; na : not available
- Source: INSEE
tableauTableau 5 – Payroll employment change in the competitive sector (*)
SA data in thousands
| Code | Change in 3 months | Change in 1 year | Level | ||
|---|---|---|---|---|---|
| Naf | 2009 | 2009 | 2009 | 2009 | |
| rev.2 | Q2 | Q3 | Q3 | Q3 | |
| DE | Electricity, gas, steam, and air conditioning supply; water supply, sewerage, waste management and remediation activities | 0,1 | -0,3 | 4,0 | 372,0 |
| C1 | Manufacture of food products beverage and tobacco products | 1,2 | -5,7 | -9,4 | 542,8 |
| C2 | Manufacture of coke, and refined petroleum products | -0,1 | -0,1 | -0,5 | 12,3 |
| C3 | Manufacture of computer, electronic and electrical products; manufacture of machinery and equipment | -10,5 | -7,9 | -28,9 | 490,1 |
| C4 | Manufacture of transport equipment | -3,9 | -9,2 | -19,8 | 363,9 |
| C5 | Other manufacturing | -36,3 | -26,2 | -118,2 | 1584,3 |
| FZ | Construction | -11,8 | -16,1 | -49,5 | 1439,8 |
| GZ | Wholesale and retail trade; repair of motor vehicles and motorcycles | -10,2 | -32,8 | -63,0 | 2951,3 |
| HZ | Transportation and storage | -10,3 | -7,4 | -29,3 | 1320,2 |
| IZ | Acommodation and food service activities | 1,2 | -3,8 | -2,4 | 905,0 |
| JZ | Information and communication | -10,7 | -4,9 | -18,9 | 668,9 |
| KZ | Financial and insurance activities | 1,6 | -4,3 | 2,2 | 821,2 |
| LZ | Real estate activities | -2,1 | -4,0 | -12,3 | 201,4 |
| MN | Professional, scientific and technical activities; administrative and support service activities | -5,9 | 33,4 | -143,2 | 2686,1 |
| of which: Temporary employment | 2,5 | 36,9 | -121,5 | 473,5 | |
| OQ | Public administration and defence; compulsory social security; education; human health and social work activities | 6,5 | 12,5 | 38,7 | 1859,7 |
| RU | Other service activities | 4,2 | -3,8 | 42,1 | 1699,2 |
- (*) Excl. Agriculture and public employees in non-markets sectors (administration, health, education and social activity)
- Source: INSEE
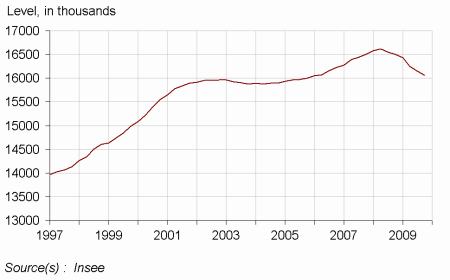
graphiqueGraph1_ – Payroll employment in principally market sectors
Documentation
Methodology (pdf,135 Ko)
Pour en savoir plus
: bureau-de-presse@insee.fr
