


 25 September 2009
2009- n° 248French GDP increased in Q2 (+0,3 %) Quarterly national accounts - detailed figures - Second Quarter 2009
25 September 2009
2009- n° 248French GDP increased in Q2 (+0,3 %) Quarterly national accounts - detailed figures - Second Quarter 2009
In the second quarter of 2009, French GDP increase in volume is confirmed (+0.3 %) * , after four quarters of contraction.
In the second quarter of 2009, French GDP increase in volume is confirmed (+0.3 %) * , after four quarters of contraction.
Production edged up
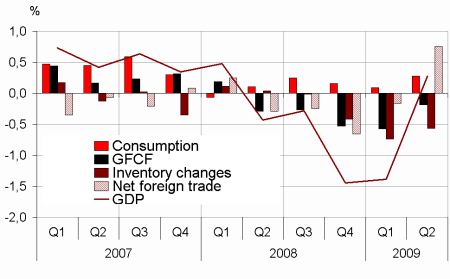
This bounce is partly due to the narrowing of the foreign trade balance this quarter: exports grew +0.7 % (after -7.4 % in Q1) while imports decreased at a milder pace than in the last quarter (-2.1 % after -5.9 %). Households’ consumption’s expenditures went up by +0.2 % (after +0.1 % in Q1) and total GFCF’s decline softened (-0.9 % after -2.6 %). Finally, inventory changes contributed negatively this quarter again (-0.6 points after -0.7 points in Q1).
Non financial corporations’ margin ratio increased by 0.2 points to 30.4 %. Purchasing power of households' gross disposable income grew by +1.1 % (after +0.4 % in Q1).
* This growth rate is seasonally and trading-day adjusted; volumes are chain-linked previous-year-prices volumes.
graphiqueGraph1 – GDP and its main components
tableauTableau 1 – GOODS AND SERVICES: RESOURCES AND USES CHAIN-LINKED VOLUMES
| ovhg | ||||||
|---|---|---|---|---|---|---|
| 2008 Q3 | 2008 Q4 | 2009 Q1 | 2009 Q2 | 2008 | 2009 | |
| GDP | -0,3 | -1,4 | -1,4 | 0,3 | 0,3 | -2,5 |
| Imports | 0,3 | -3,3 | -5,9 | -2,1 | 0,6 | -9,9 |
| Households' consumption expenditure | 0,2 | 0,1 | 0,1 | 0,2 | 0,9 | 0,5 |
| General government's consumption expenditure | 0,6 | 0,3 | 0,0 | 0,6 | 1,1 | 1,1 |
| GFCF | -1,2 | -2,5 | -2,6 | -0,9 | 0,4 | -6,0 |
| of which Non financial corporated and unincorporated enterprises | -0,6 | -2,8 | -3,7 | -0,7 | 2,4 | -6,8 |
| Households | -2,8 | -2,6 | -1,9 | -1,8 | -1,4 | -6,7 |
| General government | -1,3 | -1,6 | -0,9 | 0,3 | -4,5 | -3,2 |
| Exports | -0,6 | -6,1 | -7,4 | 0,7 | -0,6 | -12,0 |
| Contributions : | ||||||
| Internal demand excluding inventory changes | 0,0 | -0,4 | -0,5 | 0,1 | 0,9 | -0,8 |
| Inventory changes | 0,0 | -0,4 | -0,7 | -0,6 | -0,3 | -1,5 |
| Net foreign trade | -0,2 | -0,7 | -0,2 | 0,8 | -0,3 | -0,3 |
Pour en savoir plus
