


 30 September 2009
2009- n° 250The public debt reached 1428.0 billion euros Debt of the general government according to the Maastricht definition - Second Quarter
2009
30 September 2009
2009- n° 250The public debt reached 1428.0 billion euros Debt of the general government according to the Maastricht definition - Second Quarter
2009
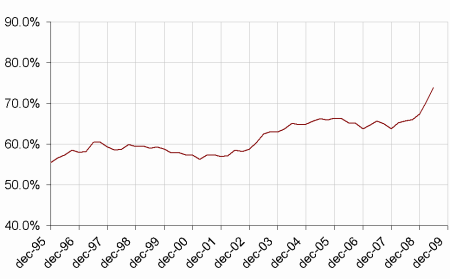
At the end of the second quarter of 2009, the public debt, which is a gross debt, reached 1428.0 billon euros, a 61.1 billion euros rise compared to Q1 2009. This figure takes into account the change of classification of the Société de financement de l’Économie Française (SFEF), which is no longer classified within general government. As a pourcentage of GDP, the debt amounted approximately to 73.9%, +3.5 points compared to Q1 2009. The growth of the general governement net debt was lower and represented approximately 66.0% of the GDP, +2.4 points compared to Q1 2009.
A strong increase of the public debt
At the end of the second quarter of 2009, the public debt, which is a gross debt, reached 1428.0 billon euros, a 61.1 billion euros rise compared to Q1 2009. This figure takes into account the change of classification of the Société de financement de l’Économie Française (SFEF), which is no longer classified within general government. As a pourcentage of GDP, the debt amounted approximately to 73.9%, +3.5 points compared to Q1 2009. The growth of the general governement net debt was lower and represented approximately 66.0% of the GDP, +2.4 points compared to Q1 2009.
graphiqueGraphIR_EN – General government debt according to the Maastricht definition (% of GDP)
tableauTableau 1 – General government debt according to the Maastricht definition at the end of Q2 2009 by sub-sector and by financial instrument category
| Q2 2008 | Q3 2008 | Q4 2008 | Q1 2009 | Q2 2009 | |
|---|---|---|---|---|---|
| General government | 1268.5 | 1284.2 | 1314.1 | 1366.9 | 1428.0 |
| % of GDP | 65.7% | 66.0% | 67.4% | 70.5% | 73.9% |
| of which, by sub-sector : | |||||
| State | 984.9 | 996.2 | 1036.2 | 1080.7 | 1135.4 |
| Central agencies | 90.7 | 94.8 | 96.1 | 109.3 | 109.8 |
| Local government | 132.8 | 134.3 | 146.7 | 142.9 | 141.1 |
| Social security funds | 60.2 | 59.0 | 35.1 | 34.0 | 41.7 |
| of which, by category : | |||||
| Currency and deposits | 15.8 | 16.0 | 23.5 | 20.7 | 19.1 |
| Securities other than shares | 1055.8 | 1070.3 | 1104.1 | 1167.2 | 1224.2 |
| Short-term | 124.7 | 150.4 | 178.3 | 218.4 | 228.2 |
| Long-term | 931.2 | 920.0 | 925.8 | 948.9 | 996.0 |
| Loans | 196.9 | 197.9 | 186.6 | 179.0 | 184.7 |
| Short-term | 45.9 | 46.3 | 16.5 | 17.1 | 23.3 |
| Long-term | 151.0 | 151.6 | 170.1 | 161.9 | 161.4 |
- Source : National accounts - Insee, DGFiP, Banque de France
Pour en savoir plus
