


 9 October 2015
2015- n° 247In August 2015, manufacturing output increased signicantly (+2.2%) Industrial production index - August 2015
9 October 2015
2015- n° 247In August 2015, manufacturing output increased signicantly (+2.2%) Industrial production index - August 2015
Warnings: Please note: all the series are seasonally (SA) and working-day adjusted (WDA).

Warnings: Please note: all the series are seasonally (SA) and working-day adjusted (WDA).
The commentary shows variations of subsections by decreasing contribution. The contribution of a subsection depends on the extent of the change and on its weight.
The models used to calculate the SA and WDA series have been updated for this publication.
In August 2015, output bounced back significantly in the manufacturing industry (+2.2% after –1.3% in July) and in the industry as a whole (+1.6% after –1.1% in July).
Manufacturing output diminished over the last three months (–0.4%)
Over the last three months, output diminished in the manufacturing sector (–0.4% q-o-q) whereas it was stable in the overall industry. Output decreased in other manufacturing (–0.5%), and plummeted in the manufacture of coke and refined petroleum products (–14.9%). Conversely, output increased in the mining, quarrying, energy and water supply (+1.8%), in the manufacture of food products and beverages (+0.7%), and more slightly in the manufacture of electrical and electronic equipment; machine equipment (+0.3%). It remained stable in the manufacture of transport equipment.
Over the year, manufacturing output increased (+0.5%)
Manufacturing output increased over the year (+0.5% y-o-y); so did overall industrial output (+0.6% y-o-y).
Over the year, output increased in most sectors: in mining, quarrying, energy and water supply (+1.5%), in the manufacture of electrical and electronic equipment (+1.2%), in the manufacture of food products and beverages (+1.4%); it rose more moderately in other manufacturing (+0.3%), and in the manufacture of transport equipment (+0.2%). On the contrary, it went down in the manufacture of coke and refined petroleum products (–4.7%).
graphiqueGraphique1a – Monthly Industrial Production Indices
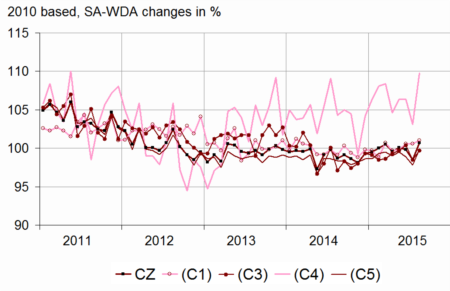
- Legend: CZ: Manufacturing - (C1): Manufacture of food products and beverages - (C3): Electrical and electronic equipment; machine equipment - (C4): Manufacture of transport equipment - (C5): Other manufacturing
- Sources: Insee, SSP, SOeS
tableauTableau1a – Variation of the Industrial Production
| NA : A10, (A17) | Aug. / July | July / June | Q-o-Q change (1) | Year on year change (2) |
|---|---|---|---|---|
| BE: INDUSTRY | 1.6 | –1.1 | 0.0 | 0.6 |
| CZ: Manufacturing | 2.2 | –1.3 | –0.4 | 0.5 |
| (C1): Manufacture of food products and beverages | 0.4 | 0.0 | 0.7 | 1.4 |
| (C2): Manufacture of coke and refined petroleum products | –0.5 | 1.0 | –14.9 | –4.7 |
| (C3): Electrical and electronic equipment; machine equipment | 1.2 | –1.9 | 0.3 | 1.2 |
| (C4): Manufacture of transport equipment | 6.5 | –3.1 | 0.0 | 0.2 |
| (C5): Other manufacturing | 2.0 | –1.1 | –0.5 | 0.3 |
| (DE): Mining and quarrying; energy; water supply; waste management | –1.0 | 0.5 | 1.8 | 1.5 |
| FZ: CONSTRUCTION | 0.6 | 0.3 | –1.1 | –5.6 |
- (1) Last three months / previous three months
- (2) Last three months / same three months of previous year
- The codes correspond to the level of aggregation A 10 (A 17) of the "NA" aggregate classification based on NAF rev.2.
- Sources: INSEE, SSP, SOeS
tableauTableau2a – Variation of the Industrial Production
| NA : A10, (A17), [A38 ou A64] | Aug. 2015 | Aug. / July | July / June | Quarter on quarter change |
|---|---|---|---|---|
| BE: INDUSTRY | 99.9 | 1.6 | –1.1 | 0.0 |
| CZ: Manufacturing | 100.7 | 2.2 | –1.3 | –0.4 |
| (C1): Man. of food products and beverages | 101.0 | 0.4 | 0.0 | 0.7 |
| (C2): Man. of coke and refined petroleum products | 78.0 | –0.5 | 1.0 | –14.9 |
| (C3): Electrical and electronic equipment; machine equipment | 99.7 | 1.2 | –1.9 | 0.3 |
| [CI] Man. of computer, electronic and optical products | 105.2 | 1.0 | –3.2 | –0.4 |
| [CJ] Man. of electrical equipment | 90.5 | 2.8 | –2.4 | –0.4 |
| [CK] Man. of machinery and equipment n.e.c. (1) | 102.2 | 0.7 | –0.9 | 1.2 |
| (C4): Man. of transport equipment | 109.8 | 6.5 | –3.1 | 0.0 |
| [CL1] Man. of motor vehicles, trailers and semi-trailers | 101.6 | 12.6 | –5.2 | 0.7 |
| [CL2] Man. of other transport equipment | 119.0 | 1.3 | –1.4 | –0.7 |
| (C5): Other manufacturing | 99.8 | 2.0 | –1.1 | –0.5 |
| [CB] Man. of textiles, wearing apparel, leather and related products | 102.9 | 9.9 | –1.2 | 1.1 |
| [CC] Man. of wood and paper products; printing and reproduction of recorded media | 89.8 | 2.3 | 0.5 | 0.4 |
| [CE] Man. of chemicals and chemical products | 116.2 | 4.9 | 0.8 | 3.3 |
| [CF] Man. of basic pharmaceutical products and pharmaceutical preparations | 110.6 | 0.2 | –0.1 | –0.5 |
| [CG] Man. of rubber and plastics products, and other non-metallic mineral products | 96.3 | 1.6 | –1.3 | –0.6 |
| [CH] Man. of basic metals and fabricated metal products, except machinery and equipment | 93.9 | 0.4 | –1.9 | –2.7 |
| [CM] Other manufacturing; repair and installation of machinery and equipment | 102.4 | 2.6 | –2.5 | –0.2 |
| (DE): Mining and quarrying; energy; water supply; waste management | 96.8 | –1.0 | 0.5 | 1.8 |
| [BZ] Mining and quarrying | 93.5 | –2.2 | –2.0 | 0.5 |
| [DZ] Electricity, gas, steam and air-conditioning supply | 94.0 | –1.2 | 0.7 | 1.5 |
| [EZ] Water supply; sewerage, waste management and remediation | 117.7 | 0.2 | 0.3 | 3.7 |
| FZ: CONSTRUCTION | 86.7 | 0.6 | 0.3 | –1.1 |
| MIGs (2) | ||||
| Capital goods | 103.1 | 3.7 | –2.6 | –0.2 |
| Intermediate goods | 96.3 | 0.4 | –0.9 | –0.9 |
| Consumer durables | 99.9 | 1.6 | –2.4 | 0.3 |
| Consumer non-durables | 106.5 | 3.2 | –0.3 | 1.1 |
| Energy | 95.3 | –0.9 | 0.6 | 0.7 |
- (1) n.e.c. : not elsewhere classifiable
- (2) Main industrial groupings: definition in Commission regulation EC of June 14th 2007
- Sources: Insee, SSP, SOeS In August 2015, output recovered significantly in other manufacturing (+2.0% after –1.1%)
Output surged in the manufacture of chemicals and chemical products (+4.9%) in particular, and bounced back in other manufacturing; repair and installation of machinery and equipment (+2.6%), in the manufacture of textiles, wearing apparel, leather and related products (+9.9%) as well as in the manufacture of rubber and plastics products, and other non-metallic mineral products (+1.6%).
Output went up sharply in the manufacture of transport equipment (+6.5% after –3.1%)
In particular, output straightened back sharply in the manufacture of motor vehicles, trailers and semi-trailers (+12.6% after –5.2% in July) where some businesses brought forward their holiday schedule, and more moderately in the manufacture of other transport equipment (+1.3% after –1.4%).
Output also increased in the electrical and electronic equipment; machine equipment (+1.2.%)
Output recovered in the manufacture of electrical equipment (+2.8% after –2.4 in July), in the manufacture of machinery and equipment n.e.c. (+0.7% after –0.9%) and in the manufacture of computer, electronic and optical products (+1.0% after –3.2%).
Output rose slightly in the manufacture of food products and beverages (+0.4%)
Output increased in the manufacture of food products and beverages (+0.4%), in particular in the manufacture of bakery and farinaceous products and in the manufacture of other food products.
Conversely, output declined in mining and quarrying; energy; water supply; waste management (–1.0%)
Output declined in electricity, gas, steam and air-conditioning supply (–1.2% after +0.7% in July).
Output also dipped in the manufacture of coke and refined petroleum products (–0.5%)
Output went down in the manufacture of coke and refined petroleum products (–0.5%) due to an unplanned maintenance in a refinery.
Revisions in July 2015
tableauTableau3a – Measure of variations' revisions
| July / June | June / May | May / April | Q2 2015 / Q1 2015 | 2014 / 2013 | |
|---|---|---|---|---|---|
| Industry (BE) | –0.30 | 0.40 | 0.00 | 0.30 | –0.20 |
| raw serie | –0.10 | 0.02 | 0.08 | –0.01 | –0.18 |
| SA-WDA coefficient | –0.20 | 0.38 | –0.08 | 0.31 | –0.02 |
| Manufacturing (CZ) | –0.39 | 0.30 | 0.00 | 0.40 | –0.24 |
| raw serie | –0.19 | 0.16 | –0.02 | 0.07 | –0.22 |
| SA-WDA coefficient | –0.20 | 0.14 | 0.02 | 0.33 | –0.02 |
- Note of reading: in the manufacturing sector. the SA-WDA evolution between June 2015 and July 2015 is revised by -0.39 point; -0.19 is due to the raw data revision and -0.20 to the new SA-WDA coefficients and models.
- Sources: Insee, SSP, SOeS
Documentation
Methodology (pdf,163 Ko)
Pour en savoir plus
