


 17 December 2015
2015- n° 305In Q3 2015, the labour cost index - wages and salaries increased by 0.1% and the labour
cost index - total labour cost increased by 0.2% Labor cost index in industry, construction and services - 3rd quarter, 2015
17 December 2015
2015- n° 305In Q3 2015, the labour cost index - wages and salaries increased by 0.1% and the labour
cost index - total labour cost increased by 0.2% Labor cost index in industry, construction and services - 3rd quarter, 2015
In the third quarter of 2015, the labour cost index (LCI) - wages & salaries in the non-agricultural market sector excluding household services, in seasonally adjusted data rose at the same pace as in Q2 2015 in quarterly change (+0.1%), as in year-on-year changes (+1.5%). Worked hours remained stable in year-on-year changes.

Warning:
- Since the Q1 2015 publication, upon Eurostat request, the reference year for the labour cost indices has been 2012: the average of the four 2012 quaterly indices is equal to 100.
- Since the Q2 2015 publication, the LCI – total labour cost integrate supplementary cost components calculated on the basis of the 2012 Labour cost survey (LCS). Moreover, the LCI – total labour cost now integrate the wage bill relative to the tax credit for encouraging competitiveness and employment (CICE) that firms report in the ACOSS contribution forms. The CICE is included in labour cost indices as a subsidy received by the employer. The CICE has no impact on the variation of LCI – wages & salaries.
The labour cost index - wages & salaries increased by 0.1%
In the third quarter of 2015, the labour cost index (LCI) - wages & salaries in the non-agricultural market sector excluding household services, rose at the same pace as in Q2 2015 quarter-on-quarter (+0.1% in seasonally adjusted data), as year-on-year (+1.5%). Average working hours remained stable year-on-year.
graphiqueGraphSSangl – LCI - wages and salaries: year-on-year changes
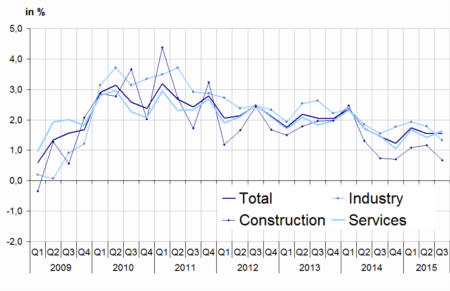
- Field: non-agricultural market sector excluding household services Sources: ACOSS, DARES, INSEE
Wages decreased in industry and construction
In Q3 2015, wages decreased in industrial activities
(-0.3% q-o-q after +0.4% in Q2 2015). Wages decreased slighty in manufacturing (–0.2% after +0.2%) and more dramatically in electricity and gas (–1,9% after +2.9%). However, wages rose in water supply activities (+0.2% as in previous quarter). Year-on-year, wages slowed down in industrial activities (+1.3% after +1.8% in Q2).
In construction, wages lowered in Q3 2015 at the same pace as in Q2 2015 (–0.2%). Wages slowed down slightly year-on-year (+0.7% after +1.2%).
Wages accelerated in services
In services, wages accelerated (+0.3% q-o-q after +0.0% in Q2). Year-on-year, wages sped up slightly (+1.6% after +1.4%).
tableautableauSSangl – LCI - wages & salaries
| Quarterly variations (%) | Annual variations (%) | |||
|---|---|---|---|---|
| Q2-15 | Q3-15 | Q2-15 | Q3-15 | |
| Industry | 0.4 | –0.3 | 1.8 | 1.3 |
| Mining and quarrying | 4.4 | –5.0 | 6.9 | 0.5 |
| Manufacturing | 0.2 | –0.2 | 1.8 | 1.4 |
| Electricity, gas, steam and air conditioning supply | 2.9 | –1.9 | 1.6 | 1.1 |
| Water supply; sewerage, waste management and remediation activities | 0.2 | 0.2 | 1.2 | 0.7 |
| Services | 0.0 | 0.3 | 1.4 | 1.6 |
| Wholesale and retail trade; repair of motor vehicles and motorcycles | 0.4 | 0.4 | 1.4 | 1.8 |
| Transportation and storage | 1.3 | –0.3 | 1.6 | 1.1 |
| Accommodation and food service activities | 0.5 | –0.5 | 1.5 | 0.9 |
| Information and communication | –0.3 | 0.5 | 1.4 | 2.1 |
| Financial and insurance activities | –0.7 | 1.0 | 1.1 | 1.7 |
| Real estate activities | 1.4 | 0.1 | 2.7 | 2.9 |
| Professional, scientific and technical activities | –1.0 | 0.3 | 1.3 | 1.2 |
| Administrative and support service activities | –0.1 | 0.5 | 1.5 | 2.2 |
| Construction | –0.2 | –0.2 | 1.2 | 0.7 |
| TOTAL | 0.1 | 0.1 | 1.5 | 1.5 |
- Field: non-agricultural market sector excluding household services Sources: ACOSS, DARES, INSEE
Slight downward revision of Q2 2015 LCI – wages and salaries, in year-on-year changes
The variation of wages and salaries during the second quarter of 2015 in the non-agricultural market sector excluding household services is revised by -0.1 points year-on-year, and is not revised quarter-on-quarter.
The labour cost index - total labour cost increased by 0.2%
In the third quarter of 2015, the labour cost index (LCI) - total labour cost in the non-agricultural market sector excluding household services increased by +0.2% in seasonnally adjusted data, after +0.1% in the second quarter of 2015.
Year-on-year, the LCI - total labour cost increased at the same pace as in the previous quarter (+1.1%). Without the tax credit for encouraging competitiveness and jobs (CICE), the LCI - total labour cost would have risen at the same pace.
graphiqueGraphSCangl – LCI - total labor cost: year-on-year changes
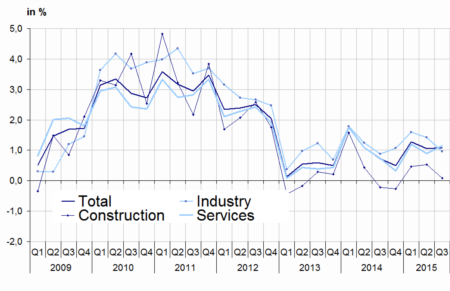
- Field: non-agricultural market sector excluding household services Sources: ACOSS, DARES, INSEE
Downward revision of Q2 2015 LCI – total labour cost, in year-on-year changes
The quarter-on-quarter change of LCI – total labour cost in the non-agricultural market sector excluding household services in the second quarter of 2015 is unchanged. The year-on-year change of Q2 2015 LCI – total labour cost is revised downward by 0.5 index point, following improvements in the measurement of the effect of Responsibility and Solidarity Pact.
tableautableauSCangl – LCI - total labor cost
| Quarterly variations (%) | Annual variations (%) | |||
|---|---|---|---|---|
| Q2-15 | Q3-15 | Q2-15 | Q3-15 | |
| Industry | 0.4 | –0.3 | 1.4 | 1.0 |
| Mining and quarrying | 4.5 | –5.0 | 6.1 | –0.4 |
| Manufacturing | 0.2 | –0.1 | 1.4 | 1.0 |
| Electricity, gas, steam and air conditioning supply | 2.9 | –1.9 | 1.5 | 1.0 |
| Water supply; sewerage, waste management and remediation activities | 0.2 | 0.2 | 0.7 | 0.0 |
| Services | 0.0 | 0.4 | 0.9 | 1.2 |
| Wholesale and retail trade; repair of motor vehicles and motorcycles | 0.5 | 0.5 | 0.8 | 1.3 |
| Transportation and storage | 1.4 | –0.3 | 0.9 | 0.4 |
| Accommodation and food service activities | 0.5 | –0.6 | 0.5 | –0.1 |
| Information and communication | –0.3 | 0.5 | 1.3 | 2.0 |
| Financial and insurance activities | –0.7 | 1.0 | 1.0 | 1.7 |
| Real estate activities | 1.5 | 0.1 | 2.3 | 2.7 |
| Professional, scientific and technical activities | –1.0 | 0.3 | 1.1 | 1.0 |
| Administrative and support service activities | –0.2 | 0.5 | 0.4 | 1.1 |
| Construction | –0.2 | –0.1 | 0.5 | 0.1 |
| TOTAL | 0.1 | 0.2 | 1.1 | 1.1 |
- Field: non-agricultural market sector excluding household services Sources: ACOSS, DARES, INSEE
tableautableauhCICEangl – LCI - total labor cost (without CICE)
| Quarterly variations (%) | Annual variations (%) | |||
|---|---|---|---|---|
| Q2-15 | Q3-15 | Q2-15 | Q3-15 | |
| Industry | 0.4 | –0.3 | 1.4 | 1.0 |
| Mining and quarrying | 4.5 | –5.0 | 6.5 | 0.0 |
| Manufacturing | 0.2 | –0.1 | 1.4 | 1.0 |
| Electricity, gas, steam and air conditioning supply | 2.9 | –1.9 | 1.5 | 1.0 |
| Water supply; sewerage, waste management and remediation activities | 0.2 | 0.2 | 0.7 | 0.1 |
| Services | 0.0 | 0.4 | 0.9 | 1.2 |
| Wholesale and retail trade; repair of motor vehicles and motorcycles | 0.5 | 0.5 | 0.8 | 1.3 |
| Transportation and storage | 1.4 | –0.3 | 0.9 | 0.4 |
| Accommodation and food service activities | 0.5 | –0.6 | 0.5 | –0.1 |
| Information and communication | –0.3 | 0.5 | 1.3 | 2.0 |
| Financial and insurance activities | –0.7 | 1.0 | 1.0 | 1.7 |
| Real estate activities | 1.5 | 0.1 | 2.4 | 2.7 |
| Professional, scientific and technical activities | –1.0 | 0.3 | 1.1 | 1.0 |
| Administrative and support service activities | –0.2 | 0.5 | 0.4 | 1.2 |
| Construction | –0.2 | –0.1 | 0.5 | 0.1 |
| TOTAL | 0.1 | 0.2 | 1.1 | 1.1 |
- Field: non-agricultural market sector excluding household services Sources: ACOSS, DARES, INSEE
Pour en savoir plus
