


 17 December 2015
2015- n° 304In November 2015, oil prices edged down anew Prices of oil and raw material imports - November 2015
17 December 2015
2015- n° 304In November 2015, oil prices edged down anew Prices of oil and raw material imports - November 2015
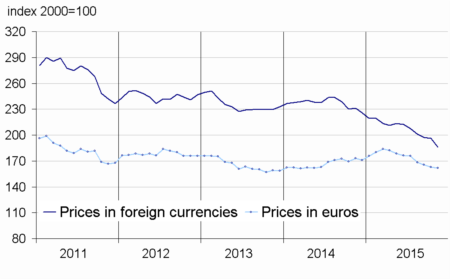
In November 2015, the crude oil price in euros fell back (–3.3% after +1.7% in October). Standing at €41.4 on average per barrel of Brent, this price tumbled by 34.1% compared to its level in November 2014 (€78.4). Prices in euros of the other imported commodities declined again (–0.8% after –1.4%): this decrease was due to industrial raw materials (–2.1%), while prices of raw food materials kept climbing (+0.7%).
In November 2015, the crude oil price in euros fell back (–3.3% after +1.7% in October). Standing at €41.4 on average per barrel of Brent, this price tumbled by 34.1% compared to its level in November 2014 (€78.4). Prices in euros of the other imported commodities declined again (–0.8% after –1.4%): this decrease was due to industrial raw materials (–2.1%), while prices of raw food materials kept climbing (+0.7%).
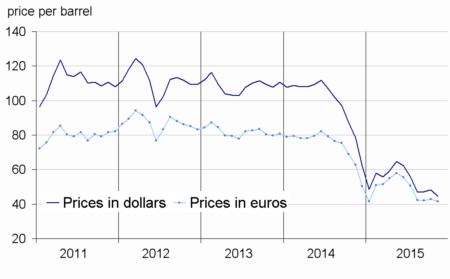
Oil prices in euros declined
The price of crude oil from the North Sea (Brent) in euros edged down (–3.3% after +1.7%), the yield and stock levels remaining high to a weak demand. The downturn was more marked in dollars (–7.7% after +1.9%) because the euro depreciated in November.
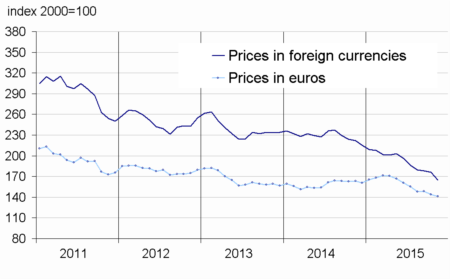
Prices of industrial raw materials went down again
Prices of industrial raw materials in euros dropped again (–2.1% after –2.9%), driven down by minerals (–3.8%). On the other hand, prices of agricultural raw materials accelerated (+3.4% after +1.0%).
Prices of minerals decreased again (–3.8% after –3.9%), mainly on account of a new downfall in iron ore prices (–8.3% after –6.7%) and of a substantial decline in prices of precious metals (–5.2% after +5.2%), in particular platine (–11.5%) and palladium (–15.6%), used in the industrial sector. Prices of non-ferrous metals came down as well (–3.0% after –4.2%), in particular industrial metals such as copper (–6.2%), whose output continued to rise, and nickel (–6.5%), for which the Chinese demand remained low.
Prices of agricultural raw materials accelerated (+3.4% after +1.0%; –1.0% year-on-year). In particular, prices of sawn softwood increased again (+5.0% after +5.2%). Prices of tropical wood picked up (+3.9% after –0.2%).Those of wood pulp recovered as well (+3.7% after –1.2%)
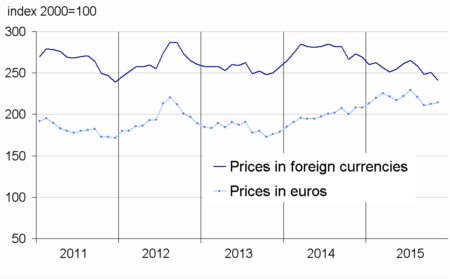
Prices of raw food materials kept rising
Prices of raw food materials in euros went up almost as much as in October (+0.7% after +0.8%). The price of sugar slowed down albeit still increasing sharply (+10.3% after +24.8%). Prices of robusta accelerated (+4.7% after +0.6%), due to a dry period in Indonesia, one of the world's main producers. However, the price of beef meat edged down (–3.7% after +3.7%), as a result of a lower demand in the USA. The price of tea fell back too (–5.4% after +5.4%).
tableautabpetrole – Oil and petroleum products
| Prices | Change (%) | |||
|---|---|---|---|---|
| of last month | over the last month | over the last 3 months | over the last 12 months | |
| Brent in $ per barrel | 44.4 | –7.7 | –5.5 | –43.4 |
| Brent in € per barrel | 41.4 | –3.3 | –1.8 | –34.1 |
| Gasoline €/L | 0.31 | 0.0 | –22.6 | –25.1 |
| Gas Oil | 406.2 | –0.4 | –2.4 | –28.4 |
| Heavy fuel | 219.7 | –2.9 | –2.8 | –32.9 |
| Naphtha | 392.4 | 1.2 | 5.2 | –22.1 |
- Prices are in euros per tonne unless otherwise specified
- Source : INSEE
tableautabmatprem – Imported raw materials (excluding energy) in euros
| Index | Changes (%) | |||
|---|---|---|---|---|
| over the last month | over the last 3 months | over the last 12 months | ||
| Food total | 214.2 | 0.7 | –3.2 | 2.8 |
| Tropical foodstuffs | 228.2 | 5.7 | 6.0 | 21.1 |
| Oil seeds, vegetable oils | 227.6 | –2.6 | –9.5 | –6.0 |
| Cereals | 150.9 | 2.2 | 0.6 | 3.6 |
| Sugar | 155.5 | 10.3 | 44.8 | 9.1 |
| Beef meat | 153.8 | –3.7 | –12.8 | –7.7 |
| Industrial raw materials | 141.1 | –2.1 | –4.5 | –13.8 |
| Agricultural raw materials | 110.7 | 3.4 | –0.2 | –1.0 |
| Natural Fibres | 123.8 | 5.4 | 0.3 | 18.8 |
| Natural rubber | 120.3 | –3.6 | –12.1 | –30.5 |
| Hides | 73.8 | –1.9 | –0.4 | –29.7 |
| Wood pulp | 104.0 | 3.7 | 0.8 | 2.5 |
| Tropical wood | 118.2 | 3.9 | 1.2 | 12.2 |
| Sawn softwood | 87.4 | 5.0 | 0.7 | –9.6 |
| Minerals | 158.1 | –3.8 | –5.8 | –17.4 |
| Iron ore | 318.8 | –8.3 | –13.5 | –26.5 |
| Non-ferrous metals | 133.3 | –3.0 | –4.9 | –18.3 |
| Precious metals | 216.5 | –5.2 | –2.3 | 1.3 |
| All commodities | 161.7 | –0.8 | –4.0 | –6.5 |
- Source : INSEE
graphiqueG_petrole_ang – Oil (Brent)
- Source : Insee
graphiqueG_alim_ang – Food
- Source : Insee
graphiqueG_ensemble_ang – Imported raw materials (excluding energy)
- Source : Insee
graphiqueG_indus_ang – Industrial raw materials
- Source : Insee
Pour en savoir plus
Time series : Raw materials prices
