


 17 December 2015
2015- n° 309In December 2015, the business climate declines in the retail trade and in the trade
and repair of motor vehicles Monthly survey of retailing - December 2015
17 December 2015
2015- n° 309In December 2015, the business climate declines in the retail trade and in the trade
and repair of motor vehicles Monthly survey of retailing - December 2015
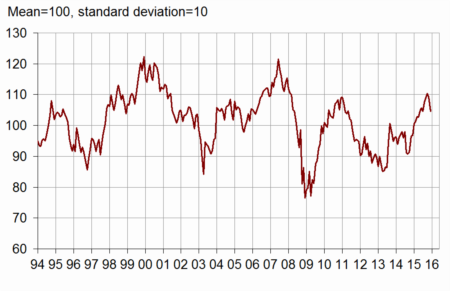
According to the managers surveyed in December 2015, the business climate has declined in the retail trade and in the trade and repair of motor vehicles. In the context of a drop in the flow of customers to some retail businesses following the terrorist attacks on 13 November 2015, the composite indicator which measures it has lost four points and has returned to the level of July 2015, a level still above its long term average (100).
According to the managers surveyed in December 2015, the business climate has declined in the retail trade and in the trade and repair of motor vehicles. In the context of a drop in the flow of customers to some retail businesses following the terrorist attacks on 13 November 2015, the composite indicator which measures it has lost four points and has returned to the level of July 2015, a level still above its long term average (100).
graphiquegraph_indsynt_en – Business climate synthetic indicator
Past and expected activity are said lower
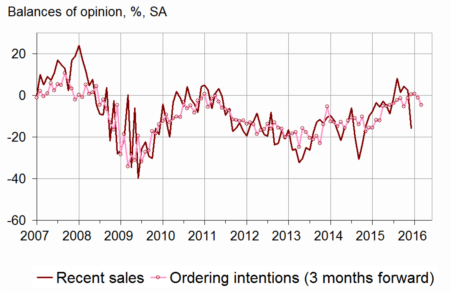
In retail trade and trade and repair of motor vehicles, many more managers than in November have declared a fall in their past activity. The corresponding balance falls down to the level of the end of 2014, below its average. This fall is mainly the fact of the retail trade sector. The prospects have shrunk too: both balances concerning expected sales and ordering intentions have declined, the first one standing at its average, the second one slightly above. The general business outlook have declined too; however, this balance was high and it remains significantly above its average.
Stocks are estimated higher, above their standard level from now on.
A little more business leaders than in November expect decreases in selling prices over the next few months.
graphiqueGraph_ventes_ic_en – Recent sales and ordering intentions
tableautab1_en – Global data
| Ave. (1) | Sept. 15 | Oct. 15 | Nov. 15 | Dec. 15 | |
|---|---|---|---|---|---|
| Business climate | 100 | 109 | 110 | 109 | 105 |
| General business outlook | –30 | –18 | –13 | –11 | –19 |
| Recent sales | –7 | 1 | 4 | 3 | –16 |
| Expected sales | –3 | 11 | 7 | 7 | –3 |
| Ordering intentions | –9 | 1 | 1 | –1 | –5 |
| Stocks | 10 | 7 | 6 | 7 | 15 |
| Past selling prices (2) | –6 | –18 | –5 | ||
| Expected selling prices | –3 | –8 | –4 | –3 | –6 |
| Cash position (2) | –15 | –16 | –14 | ||
| Workforce size: recent trend | –1 | –2 | –2 | –5 | –4 |
| Workforce size: future trend | –3 | –4 | –3 | –5 | –3 |
- (1) Average since 1991 (2004 for recent and expected sales and ordering intentions).
- (2) Bi-monthly question (odd-numbered months).
- Source: monthly survey in the retail trade and in the trade and repair of motor vehicles - INSEE
Employment forecasts near average
Both balances concerning recent and future trends on workforce size have been practically stable and have stayed near their average.
Revisions
The business climate of November 2015 has been revised downward by two points since its first estimate. This decrease is due to late answers from businesses which have been taken into account.
Retail trade
Decline of past activity in both non-specialised and specialised trade
Many more non-specialised retailers than in November have noted a decrease in their past and expected activity, especially in food and clothing sectors: each of the three balances concerning recent and expected sales and ordering intentions has significantly declined, and gone below its average.
In specialised trade, more retailers have declared dwindling past sales too, especially in clothing sector. About the next three months, their opinion hasn't varied. Both balances concerning expected sales and ordering intentions are stable, the first one below its average, the second one above.
In both kinds of trade, stocks are estimated higher.
In both non-specialised and specialised trade, the balance on expected prices has decreased, below its mean level from now on.
Trade and repair of motor vehicles
Activity balances still above their average
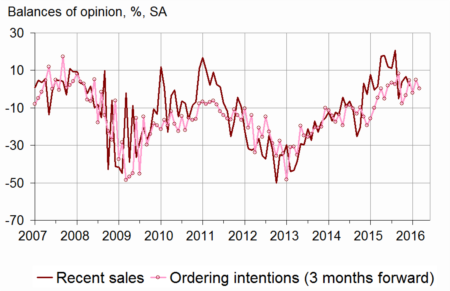
Slightly fewer motor vehicles business leaders have declared rises in their past sales, but the corresponding balance still remain significantly above its average.
Concerning the next few months, the expected sales balance is stable, while the ordering intentions one has decreased: however, both of them remain high.
graphiquegraph_ventes_ic_auto_en – Recent sales and ordering intentions in motor vehicles
Stocks are estimated higher, and have gone above their standard level.
As in November, as many motor vehicles managers forecast rises as falls in prices over the next few months.
tableautab2_en – Detailed data
| Ave. (1) | Sept. 15 | Oct. 15 | Nov. 15 | Dec. 15 | |
|---|---|---|---|---|---|
| Retail trade - Global data | |||||
| Recent sales | –6 | 4 | 5 | 1 | –23 |
| Expected sales | 0 | 7 | 8 | 7 | –4 |
| Ordering intentions | –7 | –2 | 2 | –3 | –8 |
| Stocks | 9 | 4 | 4 | 4 | 12 |
| Past selling prices (2) | –8 | –25 | –8 | ||
| Expected selling prices | –5 | –11 | –6 | –4 | –11 |
| Cash position (2) | –13 | –16 | –15 | ||
| Workforce size: recent trend | 1 | –3 | –1 | –5 | –3 |
| Workforce size: future trend | –2 | –3 | –2 | –7 | –5 |
| Non-specialised retail trade | |||||
| Recent sales | –2 | 19 | 17 | 7 | –27 |
| Expected sales | 6 | 19 | 19 | 24 | 0 |
| Ordering intentions | 1 | 11 | 11 | 4 | –4 |
| Stocks | 7 | 2 | 4 | 3 | 14 |
| Past selling prices (2) | –9 | –31 | –9 | ||
| Expected selling prices | –5 | –15 | –4 | –3 | –10 |
| Cash position (2) | –7 | –11 | –7 | ||
| Specialised retail trade | |||||
| Recent sales | –11 | –13 | –10 | –6 | –19 |
| Expected sales | –8 | –10 | –5 | –11 | –11 |
| Ordering intentions | –17 | –18 | –11 | –12 | –12 |
| Stocks | 13 | 7 | 4 | 5 | 10 |
| Past selling prices (2) | –8 | –16 | –7 | ||
| Expected selling prices | –5 | –7 | –7 | –7 | –12 |
| Cash position (2) | –22 | –24 | –23 | ||
| Trade and repair of motor cars and motorcycles | |||||
| Recent sales | –10 | –5 | 4 | 7 | 2 |
| Expected sales | –8 | 16 | 6 | 3 | 3 |
| Ordering intentions | –13 | 5 | –2 | 5 | 0 |
| Stocks | 15 | 13 | 10 | 14 | 20 |
| Past selling prices (2) | 1 | –1 | –1 | ||
| Expected selling prices | 4 | 1 | 4 | 1 | 0 |
| Cash position (2) | –25 | –15 | –16 | ||
| Workforce size: recent trend | –9 | –1 | –8 | –11 | –12 |
| Workforce size: future trend | –7 | –6 | –4 | –3 | –3 |
- (1) Average since 1991 (2003 for trade and repair of motor vehicles and 2004 for recent and expected sales and ordering intentions).
- (2) Bi-monthly question (odd-numbered months).
- Source: monthly survey in the retail trade and in the trade and repair of motor vehicles - INSEE
Documentation
Methodology (pdf,129 Ko)
Pour en savoir plus
