


 18 December 2015
2015- n° 311Business start-ups decreased in November 2015 Enterprise births - November 2015
18 December 2015
2015- n° 311Business start-ups decreased in November 2015 Enterprise births - November 2015
In November 2015, the number of business births came down by 0.7% (for all entreprises, seasonally and working-day adjusted). The downturn in self-managed micro-entrepreneurs' registrations (–2.1% after 0.5%) was only partially compensated by a slight rebound inother business start-ups (+0.3% after –0.5%).
In November 2015, the number of business births came down by 0.7% (for all entreprises, seasonally and working-day adjusted). The downturn in self-managed micro-entrepreneurs' registrations (–2.1% after 0.5%) was only partially compensated by a slight rebound inother business start-ups (+0.3% after –0.5%).
–3.5% year-on-year (quarterly basis)
The raw amount of births added up in the last three months dropped by 3.5% compared to the same months one year before. This was due to the slump of self-managed micro-entrepreneurs' registrations (–21.7%). Trade and construction were the sectors that most contributed to this fall1.
–3.8% year-on-year (twelve months basis)
The raw number of business start-ups totted up during the last twelve months slipped by 3.8% year-on-year, due to the sharp decline in self-managed micro-entrepreneurs' set-ups (–19.0%). However, other types of enterprises start-ups increased: sole proprietorships creations excluding self-managed micro-entrepreneurs shoot up (+22.3%) and companies' start-ups expanded (+3.8%).
Little less than half of business set-ups is a self-managed micro-entrepreneur's registration
In November 2015, micro–entrepreneurs' registrations amounted to 43.3% of business set-ups over the twelve last months.
tableautab0EN – Business set-ups distribution by type
| Sept. 2015 | Oct. 2015 | Nov. 2015 | |
|---|---|---|---|
| Companies | 32,0 | 32,2 | 32,5 |
| Sole proprietorships excluding self-managed micro-entrepreneurs | 22,9 | 23,6 | 24,2 |
| Self-managed micro-entrepreneurs | 45,2 | 44,2 | 43,3 |
- Source: INSEE (Sirene)

1 The contribution of a sector to the overall variation is the observed variation of this sector, weighted by the share of this sector in the total number of births.
graphiqueGraph1EN – Business start-ups (sa-wda *)
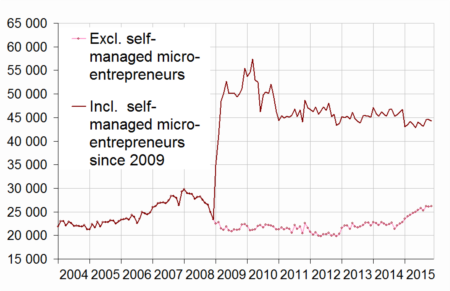
- * Seasonally and working-day adjusted data
- Source: INSEE (Sirene)
graphiqueGraph2EN – Trade and business support activities start-ups (sa-wda *)
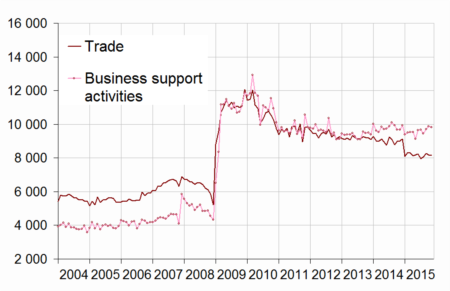
- * Seasonally and working-day adjusted data
- Source: INSEE (Sirene)
graphiqueGraph3EN – Construction and real estate business start-ups (sa-wda *)
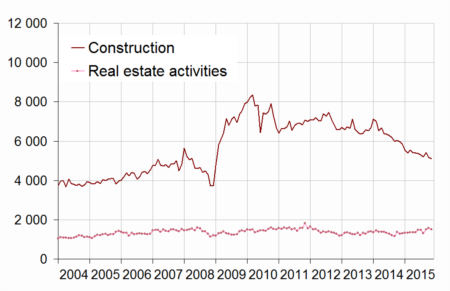
- * Seasonally and working-day adjusted data
- Source: INSEE (Sirene)
tableautab1EN – Business set-ups by month (sa-wda *)
| Aug. 2015 | Sept. 2015 | Oct. 2015 | Nov. 2015 | |
|---|---|---|---|---|
| Excl. self-managed micro-entrepreneurs | 25,251 | 26,205 | 26,077 | 26,153 |
| Variation [m-o-m] % | -1.9 | 3.8 | -0.5 | 0.3 |
| Incl. self-managed micro-entrepreneurs | 43,101 | 44,571 | 44,528 | 44,218 |
| Variation [m-o-m] % | -1.0 | 3.4 | -0.1 | -0.7 |
- * Seasonally and working-day adjusted data
- Source: INSEE (Sirene)
tableautab2EN – Business start-ups by type
| Moving total % change * | Moving total | Moving total | ||
|---|---|---|---|---|
| over 3 months | over 12 months | January- November 2015 | January- November 2014 | |
| Total | -3.5 | -3.8 | 481,569 | 506,237 |
| Companies | 6.6 | 3.8 | 155,446 | 150,339 |
| Sole proprietorships | -7.5 | -7.1 | 326,123 | 355,898 |
| Of which self-managed micro-entrepreneurs | -21.7 | -19.0 | 207,195 | 262,823 |
- * Total of business start-ups during the last 3 or 12 months compared with the same months a year earlier
- Source: INSEE (Sirene)
tableautab3EN – Number of business set-ups (incl. self-managed micro-enterprises)
| NA | Sept. 2015 | Oct. 2015 | Nov. 2015 | |
|---|---|---|---|---|
| Total | 44,571 | 44,528 | 44,218 | |
| Industry | BE | 2,034 | 2,031 | 2,044 |
| Of which Manufacturing | C | 1,785 | 1,776 | 1,769 |
| Construction | FZ | 5,416 | 5,171 | 5,111 |
| Wholesale and retail trade, Transport, Accommodation and Food and beverage activities | GI | 12,755 | 12,956 | 12,874 |
| Of which Trade | G | 8,257 | 8,182 | 8,147 |
| Of which Transportation and storage | H | 2,102 | 2,503 | 2,482 |
| Of which Accommodation and food service activities | I | 2,406 | 2,431 | 2,452 |
| Information and communication | JZ | 2,096 | 2,069 | 2,125 |
| Financial and insurance activities | KZ | 1,329 | 1,319 | 1,299 |
| Real estate activities | LZ | 1,512 | 1,589 | 1,515 |
| Business support activities | MN | 9,694 | 9,878 | 9,813 |
| Public administration and defence, education, human health and social work activities | OQ | 5,468 | 5,509 | 5,485 |
| Other services activities | RS | 4,268 | 4,008 | 3,951 |
- * Seasonally and working-day adjusted data
- Source: INSEE (Sirene)
tableautab3bisEN – Fluctuation in the number of business set-ups (incl. self-managed micro-entrepreneurs)
| NA | Nov. 15 / Oct. 15 | Moving total % change** | ||
|---|---|---|---|---|
| sa-wda * | over 3 months | over 12 months | ||
| Total | -0.7 | -3.5 | -3.8 | |
| Industry | BE | 0.7 | -16.3 | -14.2 |
| Of which Manufacturing | C | -0.4 | -18.0 | -15.9 |
| Construction | FZ | -1.1 | -13.8 | -15.9 |
| Wholesale and retail trade, Transport, Accommodation and Food and beverage activities | GI | -0.6 | -1.8 | -2.5 |
| Of which Trade | G | -0.4 | -9.7 | -8.4 |
| Of which Transportation and storage | H | -0.9 | 45.4 | 40.9 |
| Of which Accommodation and food service activities | I | 0.9 | -4.6 | -2.3 |
| Information and communication | JZ | 2.7 | -6.4 | -1.9 |
| Financial and insurance activities | KZ | -1.5 | 5.5 | 11.4 |
| Real estate activities | LZ | -4.7 | 19.6 | 5.5 |
| Business support activities | MN | -0.7 | 0.3 | -1.2 |
| Public administration and defence, education, human health and social work activities | OQ | -0.4 | 0.1 | 4.5 |
| Other services activities | RS | -1.4 | -8.6 | -7.7 |
- * Seasonally and working-day adjusted data
- ** Total of business start-ups during the last 3 or 12 months compared with the same months a year earlier
- Source: INSEE (Sirene)
Pour en savoir plus
Time series : Business demography
