


 10 December 2015
2015- n° 302In November 2015, prices of frequently purchased goods remained stable in hyper and
supermarkets Price Index in large and predominantly-food stores - November 2015
10 December 2015
2015- n° 302In November 2015, prices of frequently purchased goods remained stable in hyper and
supermarkets Price Index in large and predominantly-food stores - November 2015
In November 2015, prices of frequently purchased goods were stable in hyper and supermarkets for the second month in a row (after a decline by 0.1% in September).
In November 2015, prices of frequently purchased goods were stable in hyper and supermarkets for the second month in a row (after a decline by 0.1% in September).
In large a predominantly food stores, they increased slightly (+0.1%). Considering all the types of stores, they remained broadly unchanged.
Year-on-year, prices of frequently purchased goods decreased at a slowing pace
Year-on-year, prices of frequently purchased goods in hyper and supermarkets decreased at a more moderate pace than during previous months (–0.3% in November after –0.4% in October and –1.0% in November 2014).
In large and predominantly food stores, prices of frequently purchased goods followed the same trend: in November, they decreased also by 0.3% year-on-year.
However, excluding hyper and supermarkets, prices of frequently purchased goods rose slightly (+0.5% year-on-year after +0.8% in October). Overall, considering all stores, prices of frequently purchased goods were stable in November compared with the same month one year ago, as in October (after –0.7% in November 2014).
graphiqueGraphique1English – Frequently purchased goods price indexes year-on-year change %
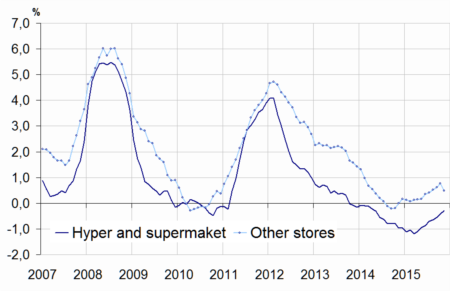
- Source: INSEE - Consumer Price Indexes
graphiqueGraphique2English – Frequently purchased goods price indexes
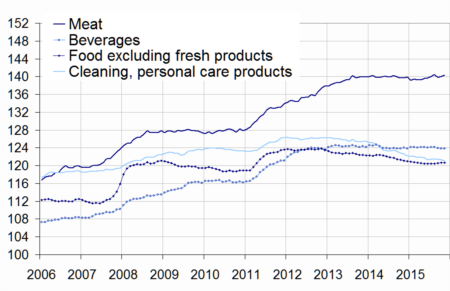
- Source: INSEE - Consumer Price Indexes
tableauTableau1English – Prices of frequently purchased goods
| Index | Changes (%) compared to | ||
|---|---|---|---|
| November 2015 | Last month (m-o-m) | 12 months before (y-o-y) | |
| Hyper-and-Supermarkets (A) | 125.56 | 0.0 | -0.3 |
| Large and predominantly food stores (A + neighborhood stores) | 126.63 | 0.1 | -0.3 |
| Other stores | 136.43 | 0.0 | 0.5 |
| All stores | 128.92 | 0.0 | 0.0 |
- Source: INSEE - Consumer Price Indexes
tableauTableau2English – Prices of frequently purchased goods detailed by main items
| Index | Changes (%) compared to | ||
|---|---|---|---|
| November 2015 | last month (m-o-m) | 12 months before (y-o-y) | |
| Food and beverages (excluding fresh foodstuffs) | 126.61 | 0.1 | -0.1 |
| - Meat | 140.41 | 0.3 | 0.5 |
| - Beverages | 123.85 | 0.0 | -0.1 |
| - Other food products | 120.63 | 0.0 | -0.4 |
| Clearing and personal care products | 121.15 | -0.1 | -1.2 |
| Total Hyper-and-Supermarkets | 125.56 | 0.0 | -0.3 |
- Source: INSEE - Consumer Price Indexes
Food prices increased slightly in hyper and supermarkets
In November 2015, prices of food, excluding fresh foodstuffs, were up slightly in hyper and supermarkets (+0.1% after 0.0%). Year-on-year, they tended to stabilize: their decrease was reduced to –0.1% in November after –0.3% in October. In November 2014, they had been down 0.7% year-on-year.
Meat prices sped up over the month (+0.3% after +0.1% in October) as year-on-year (+0.5% after +0.2% in October).
Beverage prices remained stable in November and diminished slightly year-on-year (–0.1%).
Prices of other food products were stable compared with the previous month (excluding fresh foodstuffs). Year-on-year, the rate of decrease eased (–0.4% in November, regularly up from August). In November 2014, they had been down 1.1% year-on-year.
Prices of cleaning and personal dropped slightly again in hyper and supermarkets
In November 2015, prices of cleaning and personal care products declined by 0.1%, as during the last two months. Year-on-year, they decreased by 1.2%. In November 2014, they had been down 2.3% year-on-year.
Pour en savoir plus
