

 21 December 2018
2018- n° 337In December 2018, the business climate is stable in the building construction industry Monthly survey of building - December 2018
21 December 2018
2018- n° 337In December 2018, the business climate is stable in the building construction industry Monthly survey of building - December 2018
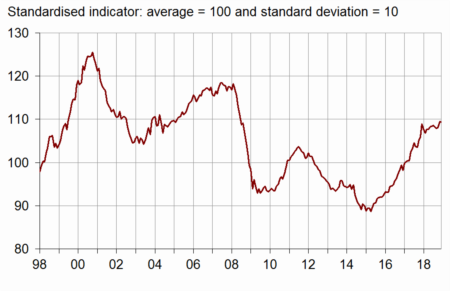
According to the business managers in the building construction industry surveyed in December 2018, the business climate is stable. The composite indicator remains at 109, well above its long-term average (100).
- More business managers report an increase in their past activity
- The business managers' opinion on the past change in their staff size deteriorates
- More business managers consider their order books well filled
- More and more obstacles to production linked to workforce shortage
- Prices more often announced to increase
According to the business managers in the building construction industry surveyed in December 2018, the business climate is stable. The composite indicator remains at 109, well above its long-term average (100).
graphiqueGraph1 – Business climate composite indicator
The turning point indicator stands in the favourable outlook area.
graphiqueGraph2 – Turning-point indicator

- Note: close to 1 (respectively –1), it indicates a favourable climate (respectively unfavourable). The uncertainty area is between –0.3 and +0.3
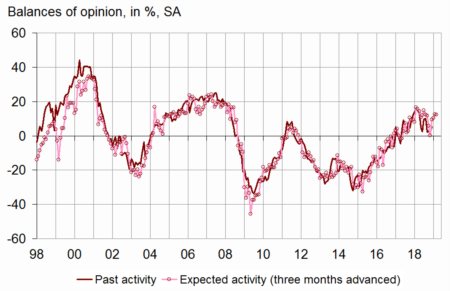
More business managers report an increase in their past activity
In December 2018, more business managers than in November have indicated an increase in their activity over the last three months. The corresponding balance of opinion has bounced back moderately and has exceeded its long-term average more largely. Otherwise, business managers remain optimistic regarding activity for the next few months: the balance on expected activity is virtually stable and stands well above its long-term mean.
graphiqueGraph3 – Activity tendency in building construction
tableauTable1 – Building industry economic outlook
| Mean* | Sept. 18 | Oct. 18 | Nov. 18 | Dec. 18 | |
|---|---|---|---|---|---|
| Composite indicator | 100 | 108 | 108 | 109 | 109 |
| Past activity | –3 | 2 | 3 | 2 | 5 |
| Expected activity | –5 | 10 | 10 | 13 | 12 |
| Gen. business outlook | –17 | 7 | |||
| Past employment | –5 | 4 | 5 | 9 | 5 |
| Expected employment | –4 | 15 | 8 | 14 | 14 |
| Opinion on order books | –23 | –11 | –12 | –7 | –5 |
| Order books (in month) | 5.6 | 7.2 | 7.3 | 7.6 | 7.5 |
| Production capacity utilisation rate | 88.5 | 90.4 | 90.2 | 90.0 | 90.1 |
| Obstacles to production increase (in %) | 32 | 38 | 38 | 37 | 38 |
| - Because of workforce shortage (in %) | 13.8 | 17.5 | 18.0 | 19.6 | 23.4 |
| Recruiting problems (in %) | 58 | 78 | |||
| Expected prices | –14 | 5 | 4 | 2 | 4 |
| Cash-flow position | –10 | –15 | |||
| Repayment period | 30 | 31 |
- * Mean since April 1975 for the composite indicator and since
- September 1993 for the balances of opinion.
- Source: INSEE, French business survey in the building industry
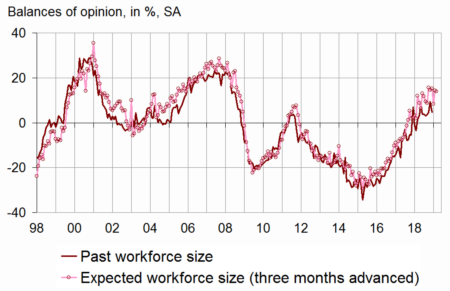
The business managers' opinion on the past change in their staff size deteriorates
In December 2018, far fewer business managers than in November have indicated an increase in their staff size over the last three months. The corresponding balance has slipped back sharply after reaching in November its highest level since August 2008. It has returned to its October level, remaining thus well above its long-term average. The balance of opinion on expected employment is stable, significantly above its long-term average.
graphiqueGraph4 – Workforce size tendency in building construction
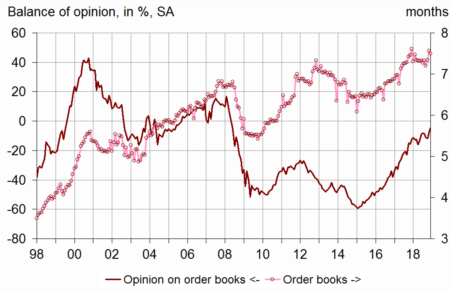
More business managers consider their order books well filled
In December 2018, more business managers than in November consider that their order books are well filled for the period. The corresponding balance of opinion has increased again and stands above its long-term average. With their present staff size, business managers consider that their order books provide 7.5 months of work, almost as high as in the previous month and largely above the long-term average (5.6 months).
graphiqueGraph5 – Order books
More and more obstacles to production linked to workforce shortage
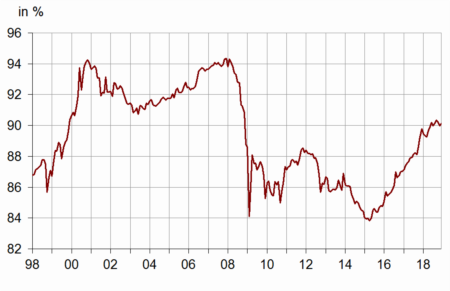
The production capacity utilisation rate is virtually stable in December 2018. At 90.1%, it remains above its long-term average. At the same time, 38% of business managers have indicated production bottlenecks, sightly more than in the previous month and the long-term average. The share of bottlenecks due to workforce shortage has continued to increase. It has risen sharply in December 2018 and has reached 23.4%, its highest level since September 2008.
graphiqueGraph6 – Production capacity utilisation rate
Prices more often announced to increase
In December 2018, slightly more business managers than in the previous month have announced that they will increase their prices during the next three months. The corresponding balance has bounced back slightly and has returned to its October level, well above its long-term average.