

 30 November 2018
2018- n° 315In Q3 2018, producer prices for services sold to French businesses increased slightly
(+0.2%) Services producer price indices - third quarter 2018
30 November 2018
2018- n° 315In Q3 2018, producer prices for services sold to French businesses increased slightly
(+0.2%) Services producer price indices - third quarter 2018
In the 3rd quarter of 2018, producer prices of services sold to French businesses went up slightly (+0.2% after +0.7%). Year over year, they ramped up (+1.5% after +1.2% in the 2nd quarter and +0.9% in the 1st quarter).
- SPPI, production sold to French businesses
- Rise in prices for transport and storage services, administrative and support services and scientific and technical services
- Seasonal downturns in prices for information-communication services and for accommodation-food services
- Decline in prices for real estate activities
- SPPI, production sold to households in France
- SPPI, production sold on foreign markets
- SPPI (all markets)
SPPI, production sold to French businesses
In the 3rd quarter of 2018, producer prices of services sold to French businesses went up slightly (+0.2% after +0.7%). Year over year, they ramped up (+1.5% after +1.2% in the 2nd quarter and +0.9% in the 1st quarter).
Rise in prices for transport and storage services, administrative and support services and scientific and technical services
Prices for transport and storage services grew by 1.0% in the 3rd quarter and gathered pace year over year (+3.5% after +2.9%). This increase was notably owing to the seasonal rise in prices for passenger air transport services and to higher tariffs in support activities for transportation.
Prices for administrative and support services kept rising this quarter (+0.4% after +0.5%), owing to the seasonal growth in prices for travel agency and tour operator services. However, employment service prices declined (−0.6% after +1.2%).
Prices for scientific and technical services increased slightly this quarter (+0.2% after +0.1%). The rise in prices for engineering services and for business and other management consulting services were not offset by the seasonal decline in prices for media representation services.
Seasonal downturns in prices for information-communication services and for accommodation-food services
Prices for information-communication services fell back in the 3rd quarter (−0.4% after +0.8%), especially due to the seasonal decrease in prices for programming and broadcasting activities (−7.0%).
Similarly, prices for accommodation-food services fell back, driven by the seasonal decline in hotel and similar accommodation services aimed to professionals.
Decline in prices for real estate activities
Prices for real estate activities dwindled in the 3rd quarter 2018 (−0.5% after +0.8%) but remained slightly growing year over year (+0.5%).
SPPI, production sold to households in France
In the 3rd quarter of 2018, producer prices of services sold to households in France accelerated (+1.8% after +0.5%). The rise was mainly owing to the summer increase in prices for accomodation services aimed to households and, to a lesser extent, to those of transport and storage service prices (+2.1%).
SPPI, production sold on foreign markets
Export prices gathered pace in the 3rd quarter of 2018 (+1.2% after +0.5%) and recovered year over year (+1.0% after −0.5%). This rise was mainly attributable to transport and storage services (+2.9%).
SPPI (all markets)
In the 3rd quarter of 2018, on all markets, producer prices of services kept increasing (+0.7% after +0.6%). Year over year, they sped up (+1.4% after +1.0%).
graphiqueGraphique1 – Producer price indices for all services

- Reference year: 2015
- Source: INSEE
graphiqueGraphique2 – Producer price indices of services sold to French businesses
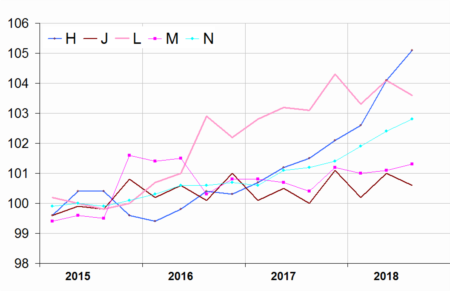
- Reference year: 2015
- Source: INSEE
graphiqueGraphique3 – Services producer price indices, all markets
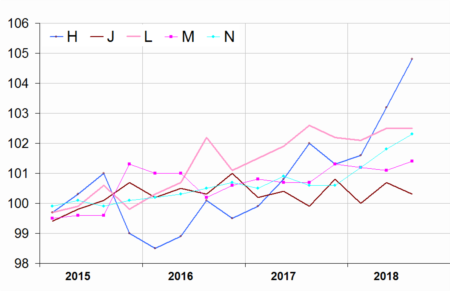
- Reference year: 2015
- Source: INSEE
tableauTableau1 – Services producer price indices, by sector
| Sections and choices of | Change in % | |||
|---|---|---|---|---|
| levels in NAF rev.2 | Weight | 2018Q03 | Q/Q-1 | Q/Q-4 |
| Prices of services sold to French businesses (BtoB) | ||||
| HS : all services | 1000 | 102.4 | 0.2 | 1.5 |
| H : transport. and storage | 204 | 105.1 | 1.0 | 3.5 |
| 49 : land and pipeline transport | 91 | 103.4 | 0.4 | 2.5 |
| 52 : warehousing and auxiliary services for transport | 79 | 106.1 | 1.1 | 5.3 |
| I : accommodation and food | 50 | 99.3 | −1.5 | 1.3 |
| J : information and communic. | 225 | 100.6 | −0.4 | 0.6 |
| 62 : IT services | 101 | 100.9 | 0.3 | 1.1 |
| L : real estate activities | 98 | 103.6 | −0.5 | 0.5 |
| M : prof., scient. and tech. | 216 | 101.3 | 0.2 | 0.9 |
| 69 : Legal and accounting services | 51 | 98.2 | −0.1 | −0.4 |
| 70 : activities of head offices and management consulting services | 45 | 101.0 | 1.2 | 1.4 |
| 71 : Architectural and engineering services | 79 | 102.6 | 0.9 | 1.1 |
| 73 : Advertising and market research services | 23 | 100.1 | −3.1 | −0.1 |
| N : administ. and support serv. | 199 | 102.8 | 0.4 | 1.6 |
| 77 : renting & leasing services | 64 | 100.1 | 0.4 | 0.8 |
| 78 : employment services | 59 | 102.4 | −0.6 | 1.4 |
| 82 : Office administrative and support services | 21 | 104.7 | 0.3 | 2.5 |
| Prices of services sold to households in France (BtoC) | ||||
| HS : all services | 1000 | 104.1 | 1.8 | 1.3 |
| H : transport. and storage | 155 | 105.6 | 2.1 | 1.2 |
| I : accommodation and food | 277 | 108.7 | 4.7 | 3.8 |
| J : information and communic. | 145 | 101.1 | −0.1 | 0.6 |
| L : real estate activities | 299 | 101.5 | 0.5 | −0.6 |
| M : prof., scient. and tech. | 74 | 103.8 | −0.2 | 0.9 |
| N : administ. and support serv. | 35 | 99.1 | 1.2 | −0.5 |
| Export prices of services (BtoE) | ||||
| HS : all services | 1000 | 100.4 | 1.2 | 1.0 |
| H : transport. and storage | 291 | 102.7 | 2.9 | 1.7 |
| J : information and communic. | 168 | 96.6 | −0.2 | −0.8 |
| M : prof., scient. and tech. | 287 | 100.1 | 0.9 | −0.1 |
| N : administ. and support serv. | 244 | 101.5 | 0.6 | 2.7 |
| Prices of services sold on all markets (BtoAll) | ||||
| HS : all services | 1000 | 102.6 | 0.7 | 1.4 |
| H : transport. and storage | 200 | 104.8 | 1.6 | 2.7 |
| I : accommodation and food | 106 | 105.8 | 2.9 | 3.1 |
| J : information and communic. | 198 | 100.3 | −0.4 | 0.4 |
| L : real estate activities | 140 | 102.5 | 0.0 | −0.1 |
| M : scient. and tech. services | 186 | 101.4 | 0.3 | 0.7 |
| N : administ. and support serv. | 161 | 102.3 | 0.5 | 1.7 |
- s: statistical confidentiality
- BtoB: business to business
- BtoC: business to consumer
- BtoE: business to exports
- BtoAll: business to all
- Source: INSEE
tableauTableau3 – Revision of variations
| Services producer price indices | 2018Q02 / 2018Q01 |
|---|---|
| - services sold to all markets | –0.1 |
| - services sold to French businesses | // |
| - services sold to consumers in France | 0.1 |
| - export of services | –0.2 |
- //: unchanged compared to the previous release
- How to read it: there was no change in the variation of the services price index for services sold to French businesses between the 1st quarter and the 2nd quarter 2018. Published at the end of August 2018 at +0,7%, it has not been revised.
- Source: INSEE
Pour en savoir plus
Time series: Services producer price indices