

 22 November 2018
2018- n° 303In November 2018, the economic climate in the building construction industry confirms
its strength Monthly survey of building - November 2018
22 November 2018
2018- n° 303In November 2018, the economic climate in the building construction industry confirms
its strength Monthly survey of building - November 2018
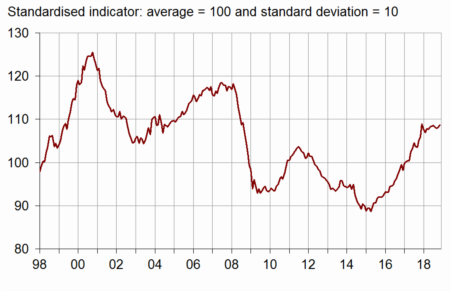
According to the business managers in the building construction industry surveyed in November 2018, the business climate, already at a high level, has improved slightly. The composite indicator has gained one point and stands at 109, its highest level since the beginning of the year and well above its long-term average (100).
- Business managers' optimism on their expected activity has strengthened
- More business managers have indicated a rise in their past and expected staff size
- More business managers consider their order books well filled
- Production capacity remains more used than in average
- Prices less often announced to increase
According to the business managers in the building construction industry surveyed in November 2018, the business climate, already at a high level, has improved slightly. The composite indicator has gained one point and stands at 109, its highest level since the beginning of the year and well above its long-term average (100).
graphiqueGraph1 – Business climate composite indicator
The turning point indicator is in the favourable outlook area.
graphiqueGraph2 – Turning-point indicator
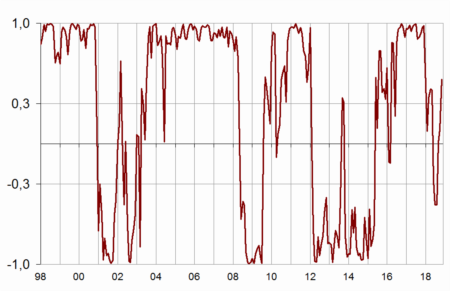
- Note: close to 1 (respectively –1), it indicates a favourable climate (respectively unfavourable). The uncertainty area is between –0.3 and +0.3
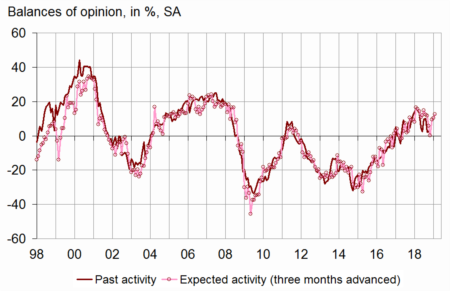
Business managers' optimism on their expected activity has strengthened
In November 2018, slightly fewer business managers than in October have indicated an increase in their activity over the last three months. The corresponding balance of opinion has edged down but remains above its long-term average. In contrast, business managers' optimism has strengthened for the next few months: the balance on expected activity has risen and has reached its highest level since May 2018, well above its long-term mean.
graphiqueGraph3 – Activity tendency in building construction
tableauTable1 – Building industry economic outlook
| Mean* | Aug. 18 | Sept. 18 | Oct. 18 | Nov. 18 | |
|---|---|---|---|---|---|
| Composite indicator | 100 | 108 | 108 | 108 | 109 |
| Past activity | –4 | 10 | 2 | 3 | 1 |
| Expected activity | –5 | 0 | 10 | 10 | 13 |
| Gen. business outlook | –17 | 7 | |||
| Past employment | –5 | 3 | 4 | 5 | 8 |
| Expected employment | –4 | 15 | 15 | 8 | 13 |
| Opinion on order books | –23 | –9 | –11 | –12 | –10 |
| Order books (in month) | 5.6 | 7.3 | 7.2 | 7.3 | 7.5 |
| Production capacity utilisation rate | 88.5 | 90.2 | 90.4 | 90.2 | 89.8 |
| Obstacles to production increase (in %) | 32 | 37 | 38 | 38 | 36 |
| - Because of workforce shortage (in %) | 13.8 | 17.2 | 17.5 | 18.0 | 18.9 |
| Recruiting problems (in %) | 58 | 78 | |||
| Expected prices | –14 | 6 | 5 | 4 | 2 |
| Cash-flow position | –10 | –15 | |||
| Repayment period | 30 | 31 |
- * Mean since April 1975 for the composite indicator and since
- September 1993 for the balances of opinion.
- Source: INSEE. French business survey in the building industry
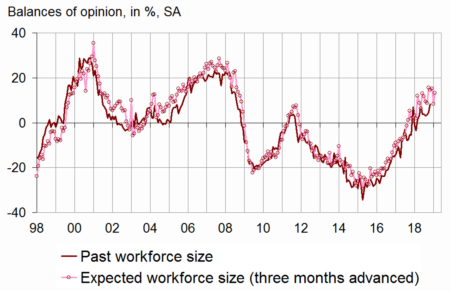
More business managers have indicated a rise in their past and expected staff size
In November 2018, many more business managers than in October have indicated an increase in their staff size over the last three months. The corresponding balance has increased for the third month in a row and has reached its highest level since September 2008. The balance of opinion on expected employment has recovered sharply after a significant decrease in October; remaining thus above its long-term average.
graphiqueGraph4 – Workforce size tendency in building construction
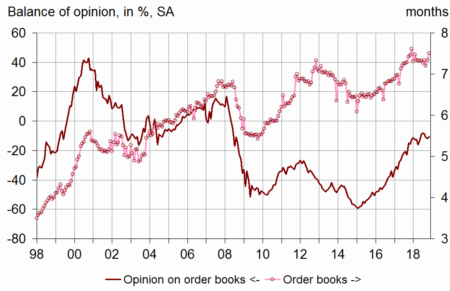
More business managers consider their order books well filled
In November 2018, slightly more business managers than in October consider that their order books are well filled for the period. The corresponding balance of opinion has recovered moderately after three consecutive months of decrease and remains above its long-term average. With their present staff size, business managers consider that their order books provide 7.5 months of work, that is the longest period since the beginning of the year and largely above the long-term average (5.6 months).
graphiqueGraph5 – Order books
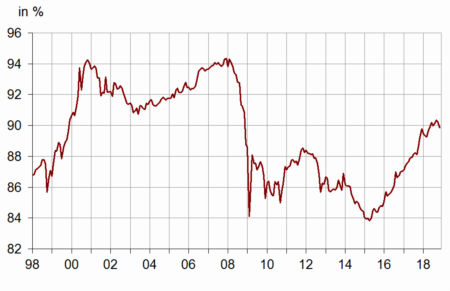
Production capacity remains more used than in average
The production capacity utilisation rate has decreased in November 2018, for the second consecutive month (89.8%). At the same time, 36% of business managers have indicated production bottlenecks, that is less than in the previous month but more than the long-term average. The share due to workforce shortage has continued to increase, reaching 18.9%, its highest level since October 2008.
graphiqueGraph6 – Production capacity utilisation rate
Prices less often announced to increase
In November 2008, again slightly fewer business managers than in the previous month have announced that they will increase their prices during the next three months. The corresponding balance has decreased since August but remains well above its long-term average.
Documentation
Abbreviated methodology (pdf,177 Ko)