

 28 September 2018
2018- n° 263In August 2018, the turnover in large-scale food retailing fell back (−1.9%) Turnover in large-scale food retailing - August 2018
28 September 2018
2018- n° 263In August 2018, the turnover in large-scale food retailing fell back (−1.9%) Turnover in large-scale food retailing - August 2018
In August 2018, the turnover in large-scale food retailing fell back after an increase in July (−1.9% after +0.9%). Sales dwindled in food products (−2.2% after +1.0%) and in non-food products (−1.3% after +1.5%). Sales of automotive fuel bounced back (+0.8% after −0.7%).
Sales fell back both in supermarkets (−2.8% after +0.7%) and in hypermarkets (−1.5% after +0.9%).
Slight increase over the last three months
Over the last three months (June to August), the turnover in large-scale food retailing increased slightly compared to the previous three months (+0.3%). Over that period, sales fell back in food products (−0.4%) and in non-food products (−1.2%). Sales in automotive fuel grew sharply (+3.4%).
Turnover decreased in supermarkets (−0.6%) whereas it increased in hypermarkets (+0.5%).
Growth of 3.2% over a year
The turnover of the past three months in large-scale food retailing rose by 3.2% compared to the same period one year earlier. Sales in food products increased (+1.5%) whereas they decreased in non-food products (−3.5%). Sales of automotive fuel surged (+20.7%). Year on year, sales increased more in supermarkets (+3.9%) than in hypermarkets (+3.1%).
graphiqueGraph1 – Turnover in large-scale food retailing by type of retail stores
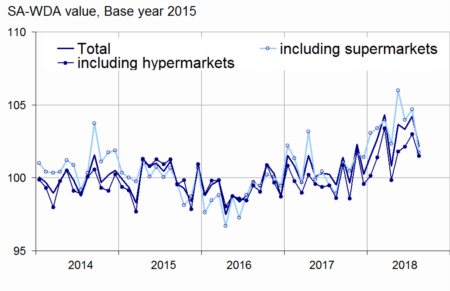
- Source: INSEE - Monthly survey of large-scale food retail activities (Emagsa)
graphiqueGraph2 – Turnover in super. and hypermarkets by type of products
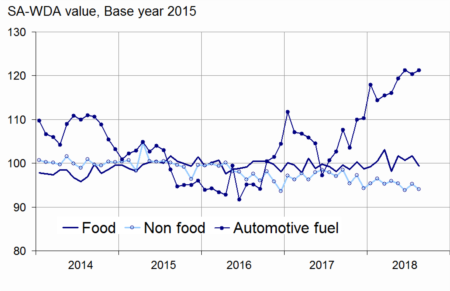
- Source: INSEE - Monthly survey of large-scale food retail activities (Emagsa)
graphiqueGraph3 – Turnover in supermarkets by type of products
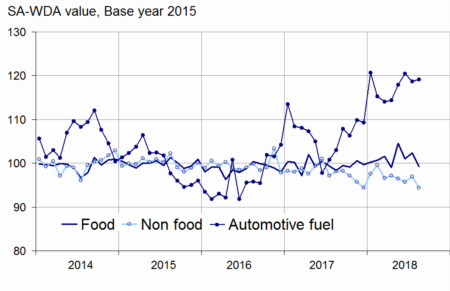
- Source: INSEE - Monthly survey of large-scale food retail activities (Emagsa)
graphiqueGraph4 – Turnover in hypermarkets by type of products
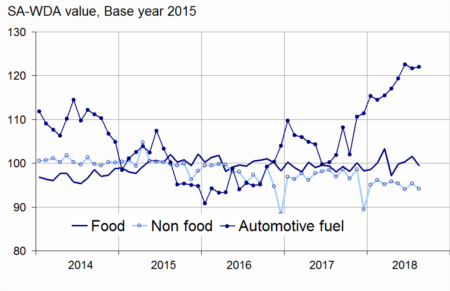
- Source: INSEE - Monthly survey of large-scale food retail activities (Emagsa)
tableauTable1 – Turnover in large-scale food retailing
| Variation en % | |||||
|---|---|---|---|---|---|
| Kind of stores or kind of products | Aug./July | July/June | June/May | q-o-q (1) | y-o-y (2) |
| Turnover (*) | –1.9 | 0.9 | –0.3 | 0.3 | 3.2 |
| including | |||||
| Sales of food products(**) | –2.2 | 1.0 | –1.0 | –0.4 | 1.5 |
| Sales of non-food products(**) | –1.3 | 1.5 | –1.6 | –1.2 | –3.5 |
| Sales of automotive fuel(**) | 0.8 | –0.7 | 1.5 | 3.4 | 20.7 |
| including | |||||
| Supermarkets(***) | –2.8 | 0.7 | –1.9 | –0.6 | 3.9 |
| Hypermarkets(***) | –1.5 | 0.9 | 0.3 | 0.5 | 3.1 |
- (1) Quarter-on-quarter: last three months / previous three months (2) Year-on-year: last three months / same three months of previous year
- (*): including sales not in stores
- (**): sold in supermarkets or hypermarkets
- (***): excluding sales not in stores
- Source: INSEE - Monthly survey of large-scale food retailing activities (Emagsa)
tableauTable2 – Revisions of variations
| July/ June | June/ May | May/ Apr | Q2 2018/ Q1 2018 | 2017/ 2016 | |
|---|---|---|---|---|---|
| Large-scale food retailing | –0.20 | 0.02 | 0.11 | –0.07 | 0.00 |
| raw serie | –0.29 | 0.05 | 0.00 | 0.02 | 0.00 |
| SA-WDA parameters | 0.09 | –0.03 | 0.11 | –0.09 | 0.00 |
- How to read it: Within large scale food retailing, the SA-WDA variation between June and July was revised by -0.20 points: -0.29 points are due to the raw series' revision and +0.09 points to the new calculation of the SA-WDA
- Source: INSEE - Monthly survey of large-scale food retailing activities (Emagsa)
Revisions
The variation in the turnover of large-scale food-retailing for July 2018 has been revised downwards by 0.2 points to +0.9% instead of +1.1% previously published.