

 28 September 2018
2018- n° 259In August 2018, further increase in producer prices in industry (+0.3%) Industrial Producer and Import Price Indices - August 2018
28 September 2018
2018- n° 259In August 2018, further increase in producer prices in industry (+0.3%) Industrial Producer and Import Price Indices - August 2018
On all markets (French market and foreign markets), producer prices in industry rose for the fourth consecutive month (+0.3% after +0.6% in July); year over year, they remained dynamic (+3.6% after +3.7% in July).
Producer prices in French industry: +0.3% in August 2018
On all markets (French market and foreign markets), producer prices in industry rose for the fourth consecutive month (+0.3% after +0.6% in July); year over year, they remained dynamic (+3.6% after +3.7% in July).
FRENCH MARKET: +0.2%
In August, French producer prices in industry for the French market grew by 0.2%, due to the rise in mining and quarrying products, energy and water prices and manufactured product prices.
Increase in prices of mining and quarrying products, energy and water
The prices of mining and quarrying products, energy and water rose again in August (+0.6% after +2.3%), as well as year over year (+4.8% after +5.5%). The electricity selling prices increased again (+1.9% after +4.8%), essentially on the wholesale market.
Growth in prices of refined petroleum products
In August, the prices of refined petroleum products grew by 1.4% (after +0.9% in July), mainly due to the increase in gas oil and super-grade fuel prices. Year over year, the rise remained very sharp (+40.0% in August after +42.7% in July).
Slight increase in food and beverage prices
In August, food and beverage prices went up slightly (+0.2% after +0.3%), due to the growth in processed and preserved meat prices and oil and fat prices. Year over year, they were unchanged, as in the past month.
Stability in prices of “other industrial products”
The prices of “other industrial products” were stable in August. Year over year, they grew by 2.4% (after +2.5% in July).
FOREIGN MARKETS: +0.3%
In August 2018, the producer prices of French industrial products sold on foreign markets rose by 0.3% (as in July), essentially due to the growth in electricity wholesale market selling prices. Export prices of manufactured products were virtually stable (+0.1%). Those of refined petroleum products rose by +1.3% (+35.0% year over year). Export prices of “other industrial products” were almost unchanged in August, the overall incresase of prices were almost offset by the decline in pharmaceutical product prices. Year over year, export prices of industrial products accelerated again (+3.5% after +3.0% in July).
Import price indices of industrial products: +0.1% in August
In August 2018, the import prices of industrial products were virtually stable (+0.1%, after +0.3% in July). Year over year, they remained strong (+4.6% after +5.1% in July). The import prices of manufactured products were almost unchanged in August as in July. Those of coke and refined petroleum products rose by 1.0%. Food and beverage prices fell back for the first time since February (−0.2% in August) and remained decreasing year over year (−1.1%).
graphiqueGraph1 – Total Industry price indices
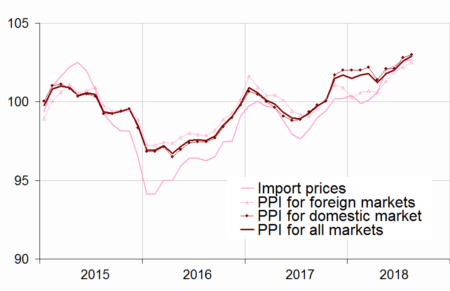
- Reference year: 2015
- Source: INSEE
graphiqueGraph2 – Producer price indices of manufactured products sold on the French market
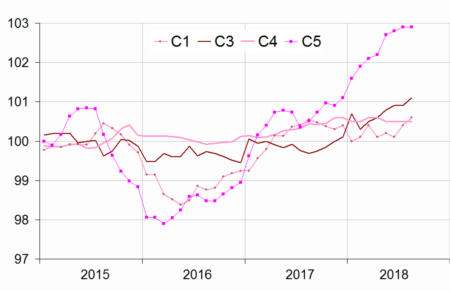
- Reference year: 2015
graphiqueGraph3 – Producer price indices of coke and refined petroleum products sold on the French market
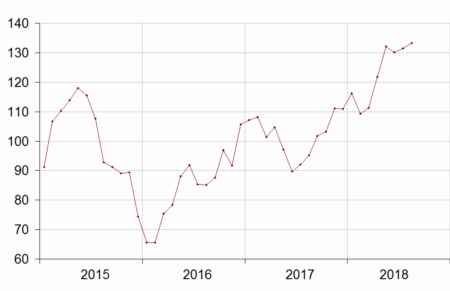
- Reference year: 2015
- Source: INSEE
tableauTable1 – French Producer Price Indices in industry according to the market where the products are sold:
| Change in % | ||||
|---|---|---|---|---|
| Levels A 10 and A 17 in CPF rev. 2, 2008 | Weight | Aug.18 | In 1 month | In 1 year |
| French market | ||||
| BE:TOTAL INDUSTRY | 1000 | 103.0 | 0.2 | 3.7 |
| (DE) Mining and quarrying, energy, water | 215 | 101.5 | 0.6 | 4.8 |
| CZ: Manufactured prod. | 785 | 103.5 | 0.2 | 3.5 |
| (C1) Food products, beverages, tobacco | 194 | 100.6 | 0.2 | 0.0 |
| (C2) Coke and refined petroleum products | 46 | 133.2 | 1.4 | 40.0 |
| (C3) Electrical & electronic equip., computers, mach. | 69 | 101.1 | 0.2 | 1.4 |
| (C4) Transport equipment | 125 | 100.5 | 0.0 | 0.1 |
| (C5) Other man. products | 351 | 102.9 | 0.0 | 2.4 |
| Foreign markets | ||||
| BE:TOTAL INDUSTRY | 1000 | 102.5 | 0.3 | 3.5 |
| CZ: Manufactured prod. | 980 | 101.8 | 0.1 | 2.5 |
| (C1) Food products, beverages, tobacco | 121 | 99.8 | 0.0 | –0.9 |
| (C2) Coke and refined petroleum products | 34 | 127.7 | 1.3 | 35.0 |
| (C3) Electrical & electronic equip., computers, mach. | 151 | 99.7 | 0.1 | 0.7 |
| (C4) Transport equipment | 207 | 101.0 | 0.0 | 1.0 |
| (C5) Other man. products | 467 | 101.3 | 0.1 | 2.1 |
| All markets | ||||
| BE:TOTAL INDUSTRY | 1000 | 102.9 | 0.3 | 3.6 |
| CZ: Manufactured prod. | 835 | 102.9 | 0.1 | 3.1 |
| (C1) Food products, beverages, tobacco | 175 | 100.5 | 0.2 | –0.1 |
| (C2) Coke and refined petroleum products | 43 | 131.5 | 1.4 | 38.9 |
| (C3) Electrical & electronic equip., computers, mach. | 90 | 100.5 | 0.2 | 1.1 |
| (C4) Transport equipment | 146 | 100.7 | 0.0 | 0.4 |
| (C5) Other man. products | 381 | 102.4 | 0.0 | 2.3 |
tableauTable2 – Import prices of industrial products
| Change in % | ||||
|---|---|---|---|---|
| Levels A 10 and A 17 in CPF rev. 2, 2008 | Weight | Aug.18 | In 1 month | In 1 year |
| BE:TOTAL INDUSTRY | 1000 | 102.7 | 0.1 | 4.6 |
| CZ: Manufactured prod. | s | 101.4 | 0.0 | 2.4 |
| (C1) Food products, beverages, tobacco | 77 | 103.8 | –0.2 | –1.1 |
| (C2) Coke and refined petroleum products | 40 | 127.9 | 1.0 | 38.7 |
| (C3) Electrical & electronic equip., computers, mach. | 219 | 98.4 | 0.1 | 0.4 |
| (C4) Transport equipment | 180 | 99.5 | –0.3 | –0.1 |
| (C5) Other manufactured products | s | 100.8 | 0.1 | 1.8 |
- nd: non available ; s : confidential
- Source: INSEE
tableauTable3 – Revision of variations
| May 18 / Apr.18 | Jun.18 / May 18 | Jul.18 / Jun.18 | |
|---|---|---|---|
| French producer prices in industry sold on: | |||
| - the French market | // | –0.1 | +0.1 |
| - the foreign markets | // | // | +0.1 |
| - all markets | –0.1 | // | +0.1 |
| Import prices of industrial products | // | // | –0.1 |
- How to read it: the variation of the producer price index in industry for products sold on the French market between June 2018 and July 2018 has been revised by +0.1 points: published last month equal to +0.6%, it as been updated to +0.7%.
- Source: INSEE