

 25 September 2018
2018- n° 249In September 2018, the economic climate is stable in the building construction industry Monthly survey of building - September 2018
25 September 2018
2018- n° 249In September 2018, the economic climate is stable in the building construction industry Monthly survey of building - September 2018
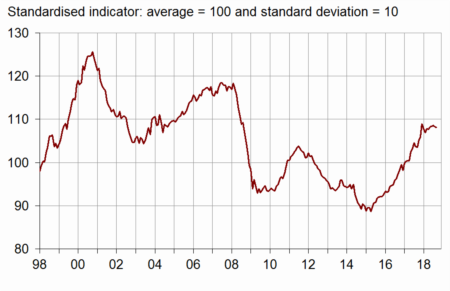
According to the business managers in the building construction industry surveyed in September 2018, the business climate is stable. The composite indicator has held steady at 108, well above its long-term average (100).
- The business managers' opinion on their past activity has deteriorated but has improved for future
- More business managers report an increase in their past staff size
- Order books are judged less well filled
- The production capacity utilisation rate has reached its highest level since the end of 2008
- Price prospects practically unchanged
According to the business managers in the building construction industry surveyed in September 2018, the business climate is stable. The composite indicator has held steady at 108, well above its long-term average (100).
graphiqueGraph1 – Business climate composite indicator
The turning point indicator has gone back into the favourable outlook area.
graphiqueGraph2 – Turning-point indicator
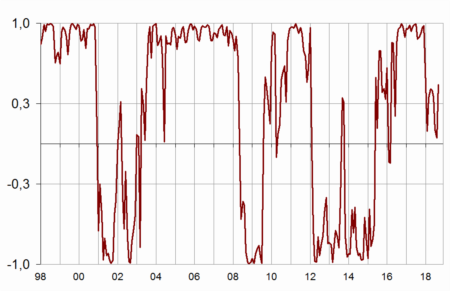
- Note: close to 1 (respectively –1), it indicates a favourable climate (respectively unfavourable). The uncertainty area is between –0.3 and +0.3
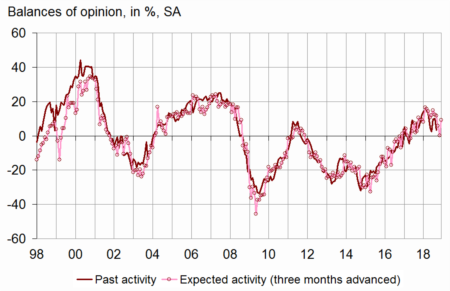
The business managers' opinion on their past activity has deteriorated but has improved for future
In September 2018, far fewer business managers than in the previous month have indicated an increase in their activity over the last three months. The corresponding balance has decreased sharply but remains above its long-term average. In contrast, the balance of opinion on expected activity has bounced back strongly and has exceeded largely its long-term average.
graphiqueGraph3 – Activity tendency in building construction
tableauTable1 – Building industry economic outlook
| Mean* | June 18 | July 18 | Aug. 18 | Sept. 18 | |
|---|---|---|---|---|---|
| Composite indicator | 100 | 108 | 109 | 108 | 108 |
| Past activity | –4 | 2 | 10 | 10 | 3 |
| Expected activity | –5 | 12 | 6 | 0 | 9 |
| Gen. business outlook | –17 | 10 | |||
| Past employment | –5 | 4 | 4 | 3 | 5 |
| Expected employment | –4 | 9 | 16 | 15 | 15 |
| Opinion on order books | –24 | –9 | –8 | –9 | –11 |
| Order books (in month) | 5.6 | 7.3 | 7.3 | 7.3 | 7.2 |
| Production capacity utilisation rate | 88.5 | 90.2 | 90.0 | 90.2 | 90.3 |
| Obstacles to production increase (in %) | 32 | 37 | 36 | 37 | 38 |
| - Because of workforce shortage (in %) | 13.7 | 16.3 | 15.3 | 17.2 | 17.2 |
| Recruiting problems (in %) | 57 | 72 | |||
| Expected prices | –14 | 4 | 8 | 6 | 5 |
| Cash-flow position | –10 | –17 | |||
| Repayment period | 30 | 34 |
- * Mean since April 1975 for the composite indicator and since
- September 1993 for the balances of opinion.
- Source: INSEE, French business survey in the building industry
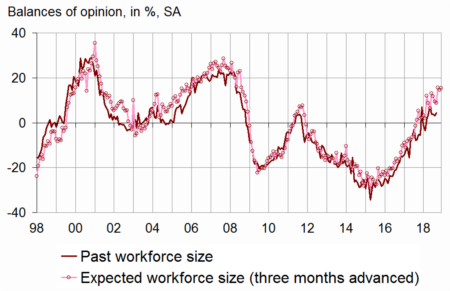
More business managers report an increase in their past staff size
In September 2018, more business managers than in August have reported an increase in their staff size over the last three months. The corresponding balance has recovered and stands well above its long-term average. Moreover, employment prospects are judged as favourable as last month: the corresponding balance of opinion is stable (after being virtually stable in August), well above its long-term average.
graphiqueGraph4 – Workforce size tendency in building construction
Order books are judged less well filled
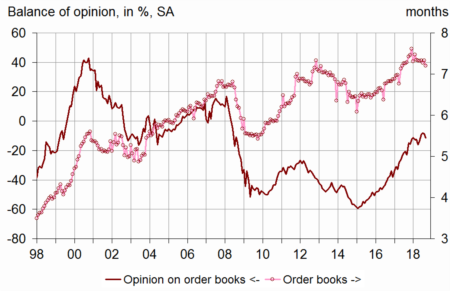
In September 2018, fewer business managers than in the previous month consider that their order books are well filled. The corresponding balance of opinion has decreased but remains well above its long-term average. With their present staff size, business managers consider that their order books provide 7.2 months of work, a level barely lower than that of last month and significantly higher than the long-term average (5.6 months).
graphiqueGraph5 – Order books
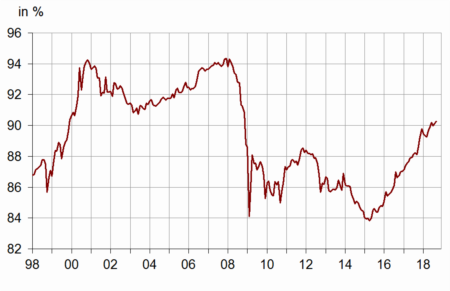
The production capacity utilisation rate has reached its highest level since the end of 2008
In September 2018, the production capacity utilisation rate has increased again slightly. At 90.3%, it stands at its highest level since December 2008. This rate has stood above its long-term average (88.5%) since October 2017. At the same time, 38% of business managers have reported production bottlenecks, slightly more than in the previous month and on long-term average. In particular, the proportion of business managers who have reported production bottlenecks because of workforce shortage is stable at 17.2%, its highest level since November 2008 and well above its long-term average (13.7%).
graphiqueGraph6 – Production capacity utilisation rate
Price prospects practically unchanged
In September 2018, almost as many business managers as in August have indicated that they will increase their prices over the next three months. The corresponding balance remains far above its long-term average.
Documentation
Abbreviated methodology (pdf,177 Ko)