

 31 August 2018
2018- n° 231In June 2018, services output was virtually stable Index of services production - June 2018
31 August 2018
2018- n° 231In June 2018, services output was virtually stable Index of services production - June 2018
In June 2018, output in services was virtually stable (+0.1%) after a decrease in May (−1.2%).
- Services output rose over the last three months
- Output grew sharply over a year
- Rebound in business support
- Strong upturn in transportation and storage
- Slight rebound in information and communication
- Virtual stability in accommodation and food service activities
- Near stability in household services
- Revisions

The commentary shows variations of subsections by decreasing contribution to the overall variation. The contribution of a subsection depends on the extent of the change and on its weight.
In June 2018, output in services was virtually stable (+0.1%) after a decrease in May (−1.2%).
Services output rose over the last three months
Over the last three months (April to June), services production increased by 1.2% compared to the previous three months.
It grew strongly in business support activities (+2.0%), be it in specialised, scientific and technical activities (+2.1%) or in administrative and business service activities (+1.9%). It rose sharply in information and communication (+2.4%) and more slightly in household services (+0.4%). The production was almost unchanged in accommodation and food services activities (+0.1). However, it decreased in transportation and storage (−0.3%) and in real estate activities (−0.6%).
Output grew sharply over a year
In services, output of the last three months rose sharply over a year (+5.0%), with an increase in all sectors.
It went up strongly in business support (+5.8%), be it in specialised, scientific and technical activities (+5.2%) or in administrative and business service activities (+6.7%). It also grew sharply in information and communication (+7.4%), household services (+6.4%) and accommodation and food service activities (+4.9%). It rose more moderatly in transportation and storage (+1.7%) and real estate activities (+1.3%).
graphiqueGraph1 – Index of services production
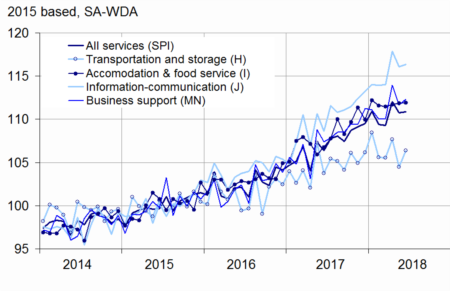
- Sources: DGFiP, INSEE
tableauTable1 – Variation in the services production
| Change in % | |||||
|---|---|---|---|---|---|
| Nace classification | Weight (1) | Jun./ May | May/ Apr. | q-o-q (2) | y-o-y (3) |
| Index of services production | 10000 | 0.1 | –1.2 | 1.2 | 5.0 |
| H Transportation and storage | 1504 | 1.9 | –3.0 | –0.3 | 1.7 |
| I Accommodation and food service activities | 870 | 0.1 | 0.2 | 0.1 | 4.9 |
| J Information and communication | 1635 | 0.3 | –1.6 | 2.4 | 7.4 |
| L Real estate activities | 964 | –5.3 | 2.3 | –0.6 | 1.3 |
| M+N Business support | 4289 | 0.6 | –2.0 | 2.0 | 5.8 |
| M Specialised, scientific and technical activities | 2540 | 0.8 | –2.0 | 2.1 | 5.2 |
| N Administrative and business service activities | 1748 | 0.4 | –2.1 | 1.9 | 6.7 |
| R+S Household services | 738 | –0.1 | 2.7 | 0.4 | 6.4 |
- (1) Weight (10 000 = H…S excepting K, O, P, Q)
- (2) Quarter-on-quarter: last three months / previous three months
- (3) Year-on-year: last three months / same three months of previous year
- Sources: DGFiP, INSEE
Rebound in business support
In June 2018, output in business support activities bounced back (+0.6% after −2.0% in May).
It recovered in specialised, scientific and technical activities (+0.8% after −2.0% in May), particularly in activities of head offices and management consultancy (+2.6% after −2.0%) and legal and accounting activities (+0.8% after −1.0%). By contrast, it still decreased in scientific research and development (−2.3% after −1.1%). Output also rebounded in administrative and business support activities (+0.4% after −2.1%), notably in services to building and landscape activities (+1.6% after −3.6%), rental and leasing activities (+0.8% after −2.5%) and security and investigation (+3.4% after −5.5%). By contrast, it went down again in employment activities(−0.9% after −1.4%).
Strong upturn in transportation and storage
Output in transportation and storage picked up in June (+1.9%) after an important decline in May (−3.0%), notably in land transport (+3.2% after −4.9%). It continued to increase strongly in air transport (+11.5% after +5.2%).
Slight rebound in information and communication
Output in information and communication bounced back slightly in June (+0.3% after −1.6%), due to computer programming (+1.4% after −3.9%) and publishing activities (+4.7% after −1.6%) and despite a withdrawal in motion picture, sound recording, music publishing (−6.7% after +4.6%).
Virtual stability in accommodation and food service activities
In June, output in accommodation and food services was virtually stable (+0.1% after +0.2%). It grew in food and beverage service activities (−0.6% after a stability) whereas it dwindled in accommodation (−1.8% after +0.8%).
Near stability in household services
Output in household services was nearly stable in June, after a sharp rise in May (+2.7%). It folded in arts, entertainment and recreation (−0.7% after +4.1%) but expanded again in other personal services production (+1.0% after +0.2%).
Revisions
The month-on-month variation rate of the index of services production in May 2018 has been revised downwards by 0.5 points. Initially published at −0.7%, it has been stated at −1.2%.
tableauTable2 – Variation in the services production
| Change in % | |||||
|---|---|---|---|---|---|
| Weight (1) | Jun. 18 | Jun./ May | May/ Apr. | q-o-q (2) | |
| Index of services production | 10000 | 110.9 | 0.1 | –1.2 | 1.2 |
| H transportation and storage | 1504 | 106.4 | 1.9 | –3.0 | –0.3 |
| 49 Land transport… | 715 | 108.5 | 3.2 | –4.9 | –1.7 |
| 50 Water transport | 36 | 112.8 | –8.4 | 0.4 | 2.5 |
| 51 Air transport | 115 | 113.5 | 11.5 | 5.2 | 2.6 |
| 52 Warehousing and support for transportation | 504 | 105.6 | –0.6 | –2.3 | 0.7 |
| 53 Postal and courier activities | 135 | 90.5 | –1.1 | –2.7 | 0.4 |
| I Accommodation and food service activities | 870 | 111.9 | 0.1 | 0.2 | 0.1 |
| 55 Accommodation | 205 | 104.4 | –1.8 | 0.8 | –1.1 |
| 56 Food and beverage service activities | 664 | 114.3 | 0.6 | 0.0 | 0.4 |
| J Information-communication | 1635 | 116.4 | 0.3 | –1.6 | 2.4 |
| 58 Publishing activities | 208 | 112.5 | 4.7 | –1.6 | 3.9 |
| 59 Motion picture, sound recording, music publishing | 119 | 107.8 | –6.7 | 4.6 | 1.4 |
| 60 Programming and broadcasting activities | 71 | 108.1 | –4.4 | 4.3 | 2.5 |
| 61 Telecommunications | 415 | 103.7 | 0.8 | 0.5 | 2.0 |
| 62 Computer programming... | 720 | 126.6 | 1.4 | –3.9 | 2.8 |
| 63 Information services | 102 | 119.1 | –6.5 | –1.4 | –0.2 |
| L Real estate activities | 964 | 98.3 | –5.3 | 2.3 | –0.6 |
| M Specialised, scientific and technical activities | 2540 | 109.7 | 0.8 | –2.0 | 2.1 |
| 69 Legal and accounting activities | 502 | 113.6 | 0.8 | –1.0 | 1.1 |
| 70 Activities of head offices and management consultancy | 739 | 112.5 | 2.6 | –2.0 | 2.8 |
| 71 Architecture and engineering activities | 491 | 107.2 | 0.6 | –2.7 | 0.6 |
| 72 Scientific research and development | 559 | 103.5 | –2.3 | –1.1 | 3.0 |
| 73 Advertising and market research | 146 | 100.4 | 0.7 | –7.1 | –0.2 |
| 74 Other professional, scientific and technical activities | 79 | 135.4 | 4.4 | –1.6 | 7.2 |
| 75 Veterinary activities | 26 | 114.6 | 0.7 | 1.2 | 2.3 |
| N Administrative and business service activities | 1748 | 116.1 | 0.4 | –2.1 | 1.9 |
| 77 Rental and leasing activities | 526 | 112.4 | 0.8 | –2.5 | 0.9 |
| 78 Employment activities | 502 | 128.5 | –0.9 | –1.4 | 2.2 |
| 79 Travel agency, tour operator | 35 | 103.5 | 3.0 | –0.9 | 0.0 |
| 80 Security and investigation | 104 | 114.1 | 3.4 | –5.5 | 3.3 |
| 81 Services to building and landscape anctivities | 245 | 112.3 | 1.6 | –3.6 | 1.9 |
| 82 Other administrative and business support activities | 336 | 108.0 | 0.1 | –0.4 | 2.9 |
| R Arts, entertainment and recreation | 460 | 119.3 | –0.7 | 4.1 | 0.6 |
| S Other personal services | 278 | 106.5 | 1.0 | 0.2 | 0.1 |
- (1) Weight (10 000 = H…S excepting K, O, P, Q)
- (2) Quarter-on-quarter: last three months / previous three months
- Sources: DGFiP, INSEE
tableauTable3 – Revision of variations
| May/ Apr. | Apr./ Mar. | Mar./ Feb. | Q1 2018/ Q4 2017 | 2017/ 2016 | |
|---|---|---|---|---|---|
| Services production | –0.50 | –0.07 | –0.02 | –0.10 | –0.06 |
| Raw series | –0.29 | –0.31 | –0.02 | 0.10 | –0.07 |
| SA-WDA parameters | –0.21 | 0.24 | 0.00 | –0.20 | 0.01 |
- How to read: in the services industries, the SA-WDA variation in output between April 2018 and May 2018 is revised by −0.50 points: −0.29 points due to the revisions of raw data and −0.21 points due to the update of SA-WDA parameters
- Sources: DGFiP, INSEE