

 23 August 2018
2018- n° 216In August 2018, the business climate rebounds slightly in the manufacturing industry Monthly business survey (goods-producing industries) - August 2018
23 August 2018
2018- n° 216In August 2018, the business climate rebounds slightly in the manufacturing industry Monthly business survey (goods-producing industries) - August 2018
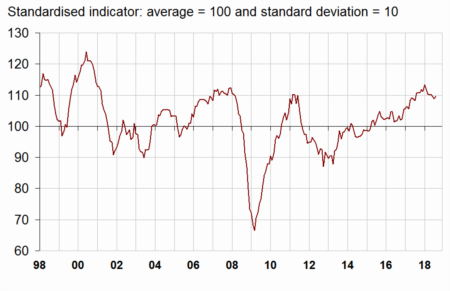
According to the business managers surveyed in August 2018, the business climate in industry has slightly improved compared to July. The composite indicator has increased by one point and is back to its June level. At 110, it is well above its long-term average (100).
- The balance of manufacturers' opinion on their past activity has sprung in August
- In the agrofood industry, the business climate has picked up slightly
- The business climate has slightly faltered in the manufacture of machinery and equipment goods
- The business climate in the manufacture of transport equipment has slightly improved
- The business climate has dipped slightly in “other manufacturing industries”
According to the business managers surveyed in August 2018, the business climate in industry has slightly improved compared to July. The composite indicator has increased by one point and is back to its June level. At 110, it is well above its long-term average (100).
graphiqueGraph 1 – Business climate in industry - Composite indicator
The turning-point indicator stands in the zone indicating a favourable economic outlook.
graphiqueGraph 2 – Turning-point indicator
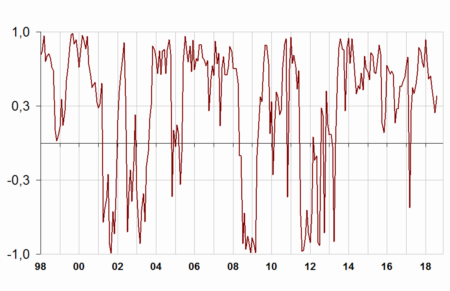
- How to read it: close to 1 (resp. -1), the indicator points to a favourable short-term economic situation (resp. unfavourable). The uncertainty area is between −0.3 and +0.3.
The balance of manufacturers' opinion on their past activity has sprung in August
The balance of industrialists' opinion on past activity, already above its long-term average, has significantly increased. That on personal production expectations has sharply dropped but remains well above its long-term average.
Manufacturers remain considerably less optimistic than at the beginning of the year about the general production prospects for the sector. The corresponding balance, however, has increased by one point in August. The balance of opinion on overall order books has slightly picked up while that on export order books has been declining since May. The corresponding balances remain well above their long-term average.
More industrialists than in July consider that their finished-goods inventories are above normal. The corresponding balance is close to its long-term mean.
As regards employment, the balances of opinion on past and expected workforce size are virtually stable, well above their long-term average.
tableauTable 1 – Industrialists' opinion on manufacturing activity
| Manufacturing industry | Ave.* | May 18 | June 18 | July 18 | Aug. 18 |
|---|---|---|---|---|---|
| Composite indicator | 100 | 110 | 110 | 109 | 110 |
| Past activity | 5 | 14 | 8 | 10 | 19 |
| Finished-goods inventory | 13 | 9 | 9 | 10 | 12 |
| Overall order books | –18 | 1 | –2 | –4 | –3 |
| Export order books | –14 | –1 | –2 | –2 | –3 |
| Past workforce size | –10 | 4 | 3 | 3 | 2 |
| Expected workforce size | –12 | 3 | 4 | 1 | 2 |
| Personal production expectations | 5 | 17 | 24 | 23 | 18 |
| General production expectations | –8 | 19 | 15 | 10 | 11 |
- * Long-term average since 1976.
- Source: INSEE - Monthly business tendency survey in industry
In the agrofood industry, the business climate has picked up slightly
In the manufacture of food products and beverages, the business climate indicator has slightly improved in August (+1 point). At 109, it far exceeds its long-term average (100). This improvement mainly comes from an increase in the balances on past activity and on overall and export order books.
The business climate has slightly faltered in the manufacture of machinery and equipment goods
In the overall manufacture of machinery and equipment goods, the business climate has decreased by one point, at 108, while remaining well above its long-term average. This dip is attributable to the decrease in the balances on overall and export order books.
The business climate is less favourable than in July in machinery and equipment and in the computer, electronic and optical product industry. By contrast, it has further improved in the electrical equipment industry.
The business climate in the manufacture of transport equipment has slightly improved
In the manufacture of transport equipment, the business climate has increased by one point. At 107, it is well above its long-term average (100). This improvement mainly comes from the increase in the balance on past activity, in particular in the motor industry.
The business climate indicator has recovered in the manufacture of motor vehicles, trailers and semi-trailers ; it is virtually stable in the manufacture of other transport equipment. In both cases, the climate is above average.
The business climate has dipped slightly in “other manufacturing industries”
In overall “other manufacturing”, the business climate is slightly less favourable. The composite indicator has edged down by 1 point. This slight dip mainly comes from the decrease in the balances on personal production expectations and on export order books.
By subsector, the business climate indicator has slightly fallen in chemicals and in the “other manufacturing industries”. It is stable in rubber and plastic products and basic metals and has increased in wood-paper, clothing-textiles.
graphiqueGraph 3 – Business climates in a sector-based approach
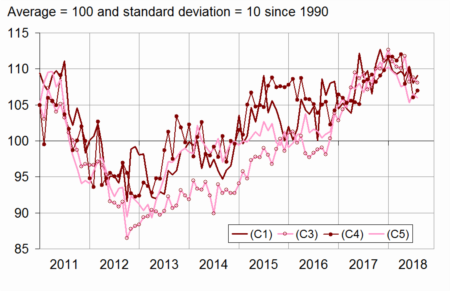
- Legend: (C1): Manufacture of food products and beverages - (C3): Machinery and equipment goods - (C4): Manufacture of transport equipment - (C5): Other manufacturing
tableauTable 2 – Business climates in a sector-based approach
| NA* : (A17) et [A38 et A64] | Weights** (%) | June 18 | July 18 | Aug. 18 |
|---|---|---|---|---|
| (C1) Man. of food products and beverages | 21 | 110 | 108 | 109 |
| (C3) Machinery and equipment goods | 11 | 108 | 109 | 108 |
| [CI] Computer, electronic and optical products | 3 | 104 | 108 | 107 |
| [CJ] Electrical equipment | 3 | 108 | 110 | 114 |
| [CK] Machinery and equipment | 5 | 110 | 107 | 103 |
| (C4) Man. of transport equipment | 17 | 110 | 106 | 107 |
| [CL1] Motor vehicles, trailers and semi-trailers | 8 | 110 | 105 | 107 |
| [CL2] Other transport equipment | 9 | 106 | 105 | 104 |
| (C5) Other manufacturing | 46 | 105 | 107 | 106 |
| [CB] Textiles, clothing industries, leather and footwear industry | 2 | 113 | 112 | 113 |
| [CC] Wood, paper, printing | 5 | 111 | 107 | 110 |
| [CE] Chemicals and chemical products | 9 | 103 | 105 | 104 |
| [CG] Rubber and plastic products | 7 | 106 | 109 | 109 |
| [CH] Basic metals and fabricated metal products | 11 | 103 | 104 | 104 |
| [CM] Other manufacturing industries | 9 | 104 | 104 | 103 |
- * NA: aggregated classification, based on the French classification of activities NAF rév.2.
- ** Weights used to aggregate sub-sector's balances of opinion.
- Source: INSEE - Monthly business tendency survey in industry

Warning: In the publication of August 2018, the weights used to aggregate the responses of the business managers have been updated. The seasonal coefficients as well as the parameters of the composite indicator have also been updated. As a result, the set of results previously published from this survey is subject to slight revisions.
Documentation
Methodology (pdf,133 Ko)
Pour en savoir plus
Time series : Industry - Activity and demand